About Colors 色について
This is an article to introduce various topics in Sketching with Code, illustrating the relationships between them and adding more context to provide a sort of overview. The articles are not in order of difficulty. Please just jump to whichever one interests you.
これは Sketching with Math and Quasi Physics 上の様々なトピックについて、それぞれの間の関係や概要を示したり、新たな文脈を加えたりするためのページです。難易度順には並んでいないので、興味のある記事から自由に読んでみてください。
Color is a fascinating topic that lies between science and human perception.
色は科学と人間の知覚の間に位置する魅力的なトピックです。
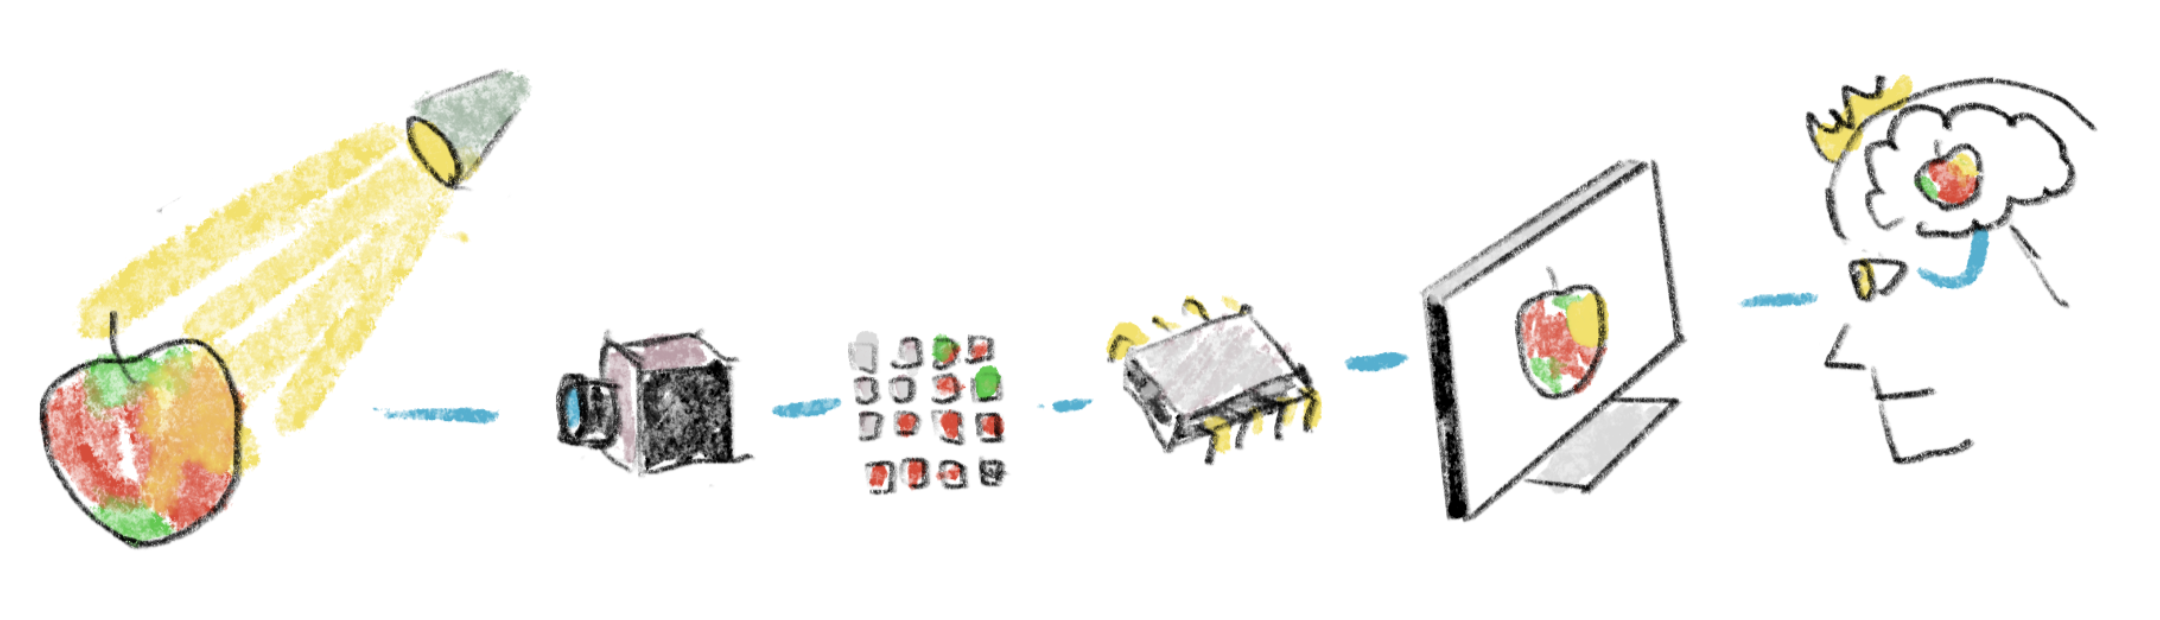
Physically, we know how humans perceive colors. We have photoreceptors called cones in our eyes that react to different frequencies of light, and the levels of stimuli to these three types of cones determine what color we see. The coverage of each type of cone roughly matches with the spectrum of red, green, and blue; that’s why RGB displays can show us various colors even though they have only three colors of light-emitting elements.
物理的な面を見ると、人間の色の知覚の仕組みは解明されています。目の中には錐体という光受容体があり、異なる周波数の光に反応します。3種類の錐体への刺激の強さの組み合わせによって、私たちが知覚する色が決まります。それぞれの錐体の感度は、赤、緑、青の波長域におおよそ対応しています。そのため、RGBディスプレイは3色の発光素子だけで、様々な色を表示できるのです。

https://commons.wikimedia.org/wiki/File:Cone-fundamentals-with-srgb-spectrum.svg
However, this model doesn’t necessarily explain what we actually experience. For example, the violet and red at both ends of the spectrum are actually continuous, with purple in between them. We see different brightness depending on the hue even when the amount of physical light is the same (in general, yellow looks much brighter than blue). We even associate different feelings, emotions, and meanings to the colors.
しかし、このモデルは必ずしも実際の体験を説明してくれません。例えば、スペクトルの両端にある紫と赤は連続的につながっていて、その間に紫色が存在します。また、物理的な光量が同じでも、色相によって明るさの感じ方が異なります(一般的に、黄色は青よりもはるかに明るく見えます)。人々は、色に対して様々な感情、意味、印象を結びつけたりもします。
Color models
カラーモデル
People have been creating different models to describe colors. These are roughly divided into two categories: ones that are mainly derived from physical properties, and ones that are more based on the ways we normally describe colors.
人々は色を表現するために様々なモデルを作り出してきました。これらは大きく2つのカテゴリーに分類されます。物理的な特性に基づくものと、私たちが日常的に色を表現する方法に基づくものです。
The first challenge in systematizing colors is that different people have different responses to the spectrum of colors. To find a sort of average, called the standard (colorimetric) observer, an experiment called Wright-Guild color matching was conducted. The basic idea is that the participant is presented with a monochromatic color, which is a color with a single frequency of light, and asked to reproduce the same color by mixing three primary colors (red, green, blue) to match with a target color.
色を体系化する最初の課題は、色のスペクトルへの反応が人によって異なることです。そこで、標準(測色)観察者というある種の平均値を見つけるため、ライトとギルドによるカラーマッチングの実験が行われました。実験の基本的な考え方はシンプルで、被験者に単色光(単一の周波数を持つ光)を見せ、3原色(赤、緑、青)を混ぜ合わせてその目標の色を再現してもらうというものです。
The tricky part is that the three physical lights can’t reproduce every color. The participants could match a lot of the target colors just by adjusting the brightness of each primary. But for some colors, they couldn’t get it right unless they actually subtracted one of the primary lights. There isn’t such a thing called negative light, so they solved this by adding the “negative” light to the target color side instead of the mixing side.
やっかいなのは、物理的な3種類の光ではすべての色を再現できないということでした。被験者は各原色の明るさを調整するだけで多くの目標色に合わせることができましたが、一部の色については、原色の光の1つを減算しないと正しく合わせることができませんでした。負の光というものは存在しないため、混色する側ではなく目標色の側に「負の」光を加えることで解決しました。
To better understand this, look at the chart above again. Because each cone covers a relatively broad range, there is no light that can stimulate them independently. There are inevitably certain balances of cone stimulations that can’t be achieved using just a combination of three lights.
この点をよりよく理解するために、上のグラフをもう一度見てみましょう。それぞれの錐体は広い波長域をカバーしており、個別の錐体だけを刺激するような光は存在しません。そのため、3つの光源の組み合わせだけでは実現できない錐体に対する刺激のバランスが必然的に生じるのです。
They eventually transformed the data into something called the CIE 1931 XYZ color space, which is basically a remapping of the RGB measurements to get rid of the negative values by picking new “primaries” that were more imaginary concepts than actual lights.
最終的に、データはCIE 1931 XYZ色空間と呼ばれるものに変換されました。これは基本的に、負の値を取り除くために実際の光ではなく仮想の新しい「原色」を選ぶことで、測定値をマッピングし直したものです。
Most color models today are based on this CIE color space, meaning that the values in a system can be converted to values in XYZ. The RGB color model that we use on computers today completely fits within the XYZ color space (because by definition, XYZ space has all the human-perceivable colors and even more).
今日使われているほとんどのカラーモデルはこのCIE色空間に基づいていて、それぞれのシステムの値はXYZ値に変換することができます。現在のコンピュータで使用されているRGBカラーモデルは、XYZ色空間の中に完全に収まっています(XYZ空間は定義上、人間が知覚できるすべての色、そしてそれ以上の色を含むためです)。
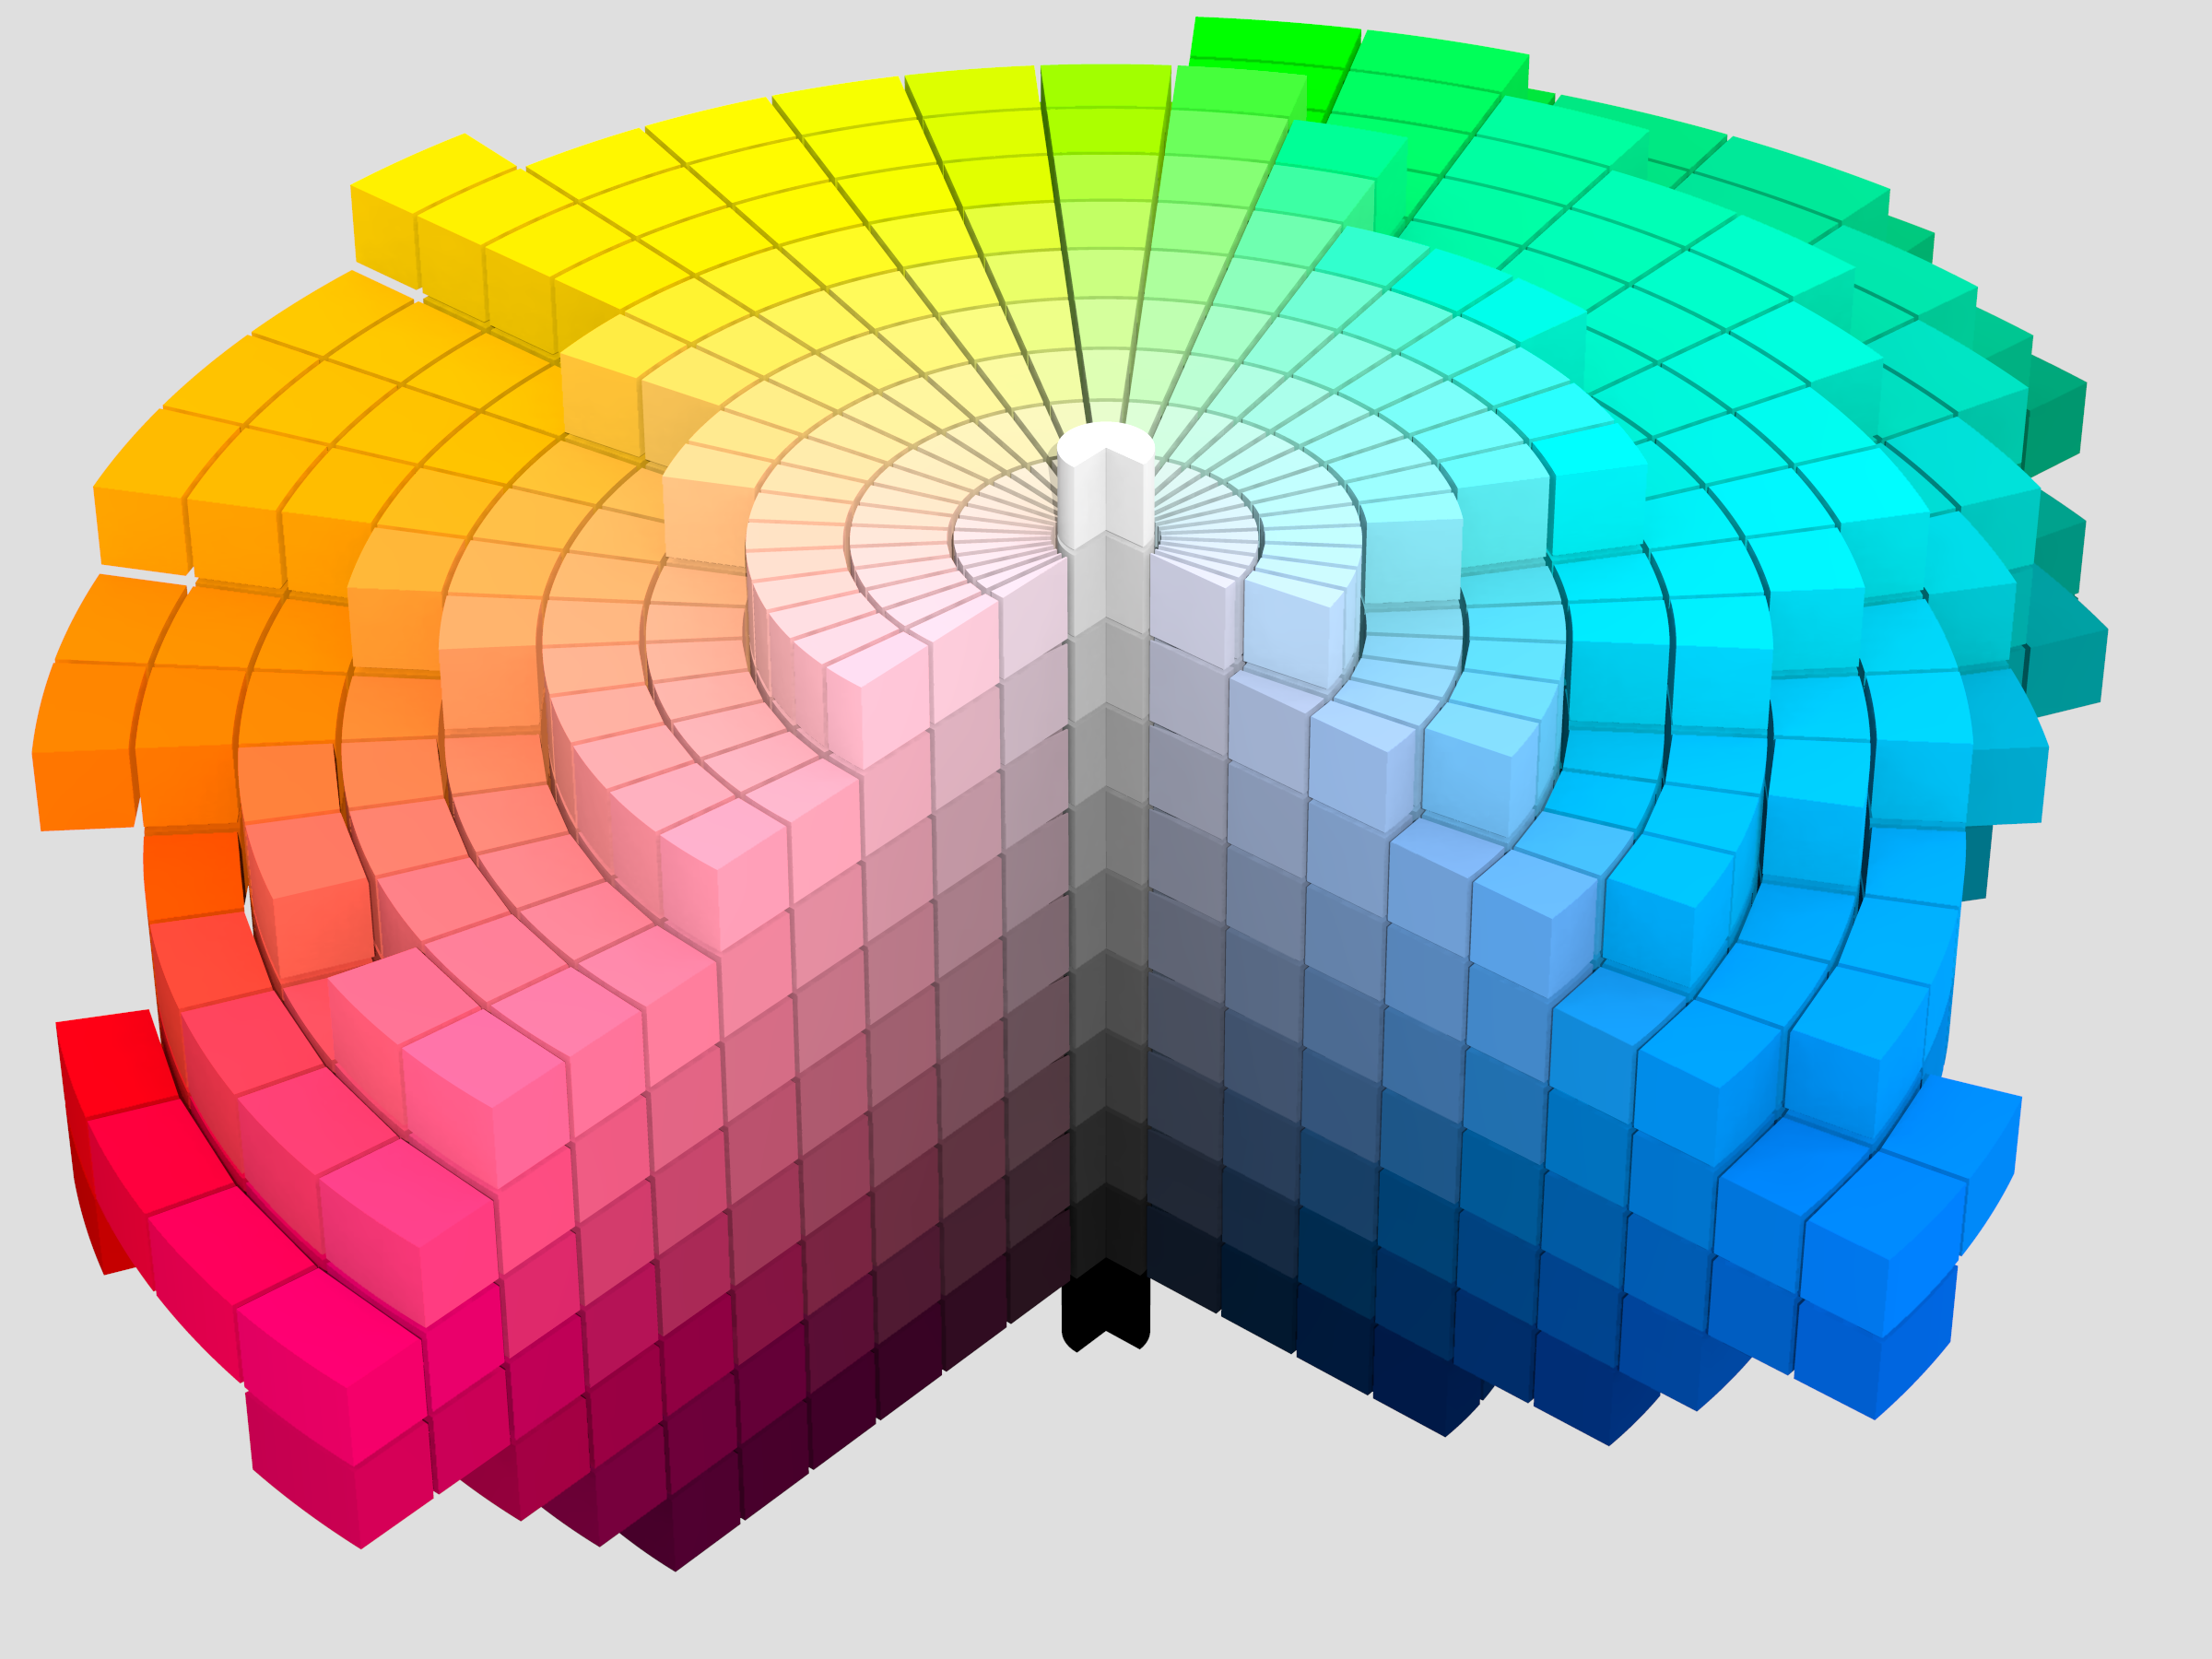
Some other ways of describing colors are based on the ways we talk about colors. When we see colors, we say which kind of colors they are (reddish, yellowish), how bright or dark they are, how saturated or vivid, or dull or grayish, etc. The Munsell color system is a system to break down colors by three attributes: hue (such as red, blue, and green), value (lightness), and chroma (vividness or purity of the color). The many color models we use on computers are similar to Munsell’s model, but are designed to be able to be mapped to the RGB values on the screen and thus to XYZ values.
色を表現する他の方法として、私たちの日常的な色の表現方法に基づいたものがあります。色を見るとき、私たちは「赤みがかった」「黄色みがかった」といった色の種類や、明るさ、鮮やかさ、くすみ具合、無彩色に近いかなどで表現します。マンセルカラーシステムは、このような直感的な表現を体系化し、色を色相(赤、青、緑など)、明度(明るさ)、彩度(色の鮮やかさや純度)の3つの属性で分類します。コンピュータで使用されるカラーモデルの多くは、このマンセルのモデルに似ていますが、画面上でのRGBの値やXYZ値に変換できるように設計されています。
Various Color Models 様々なカラーモデル
https://commons.wikimedia.org/wiki/File:Munsell_1943_color_solid_cylindrical_coordinates_gray.png
Computing colors
色を計算する
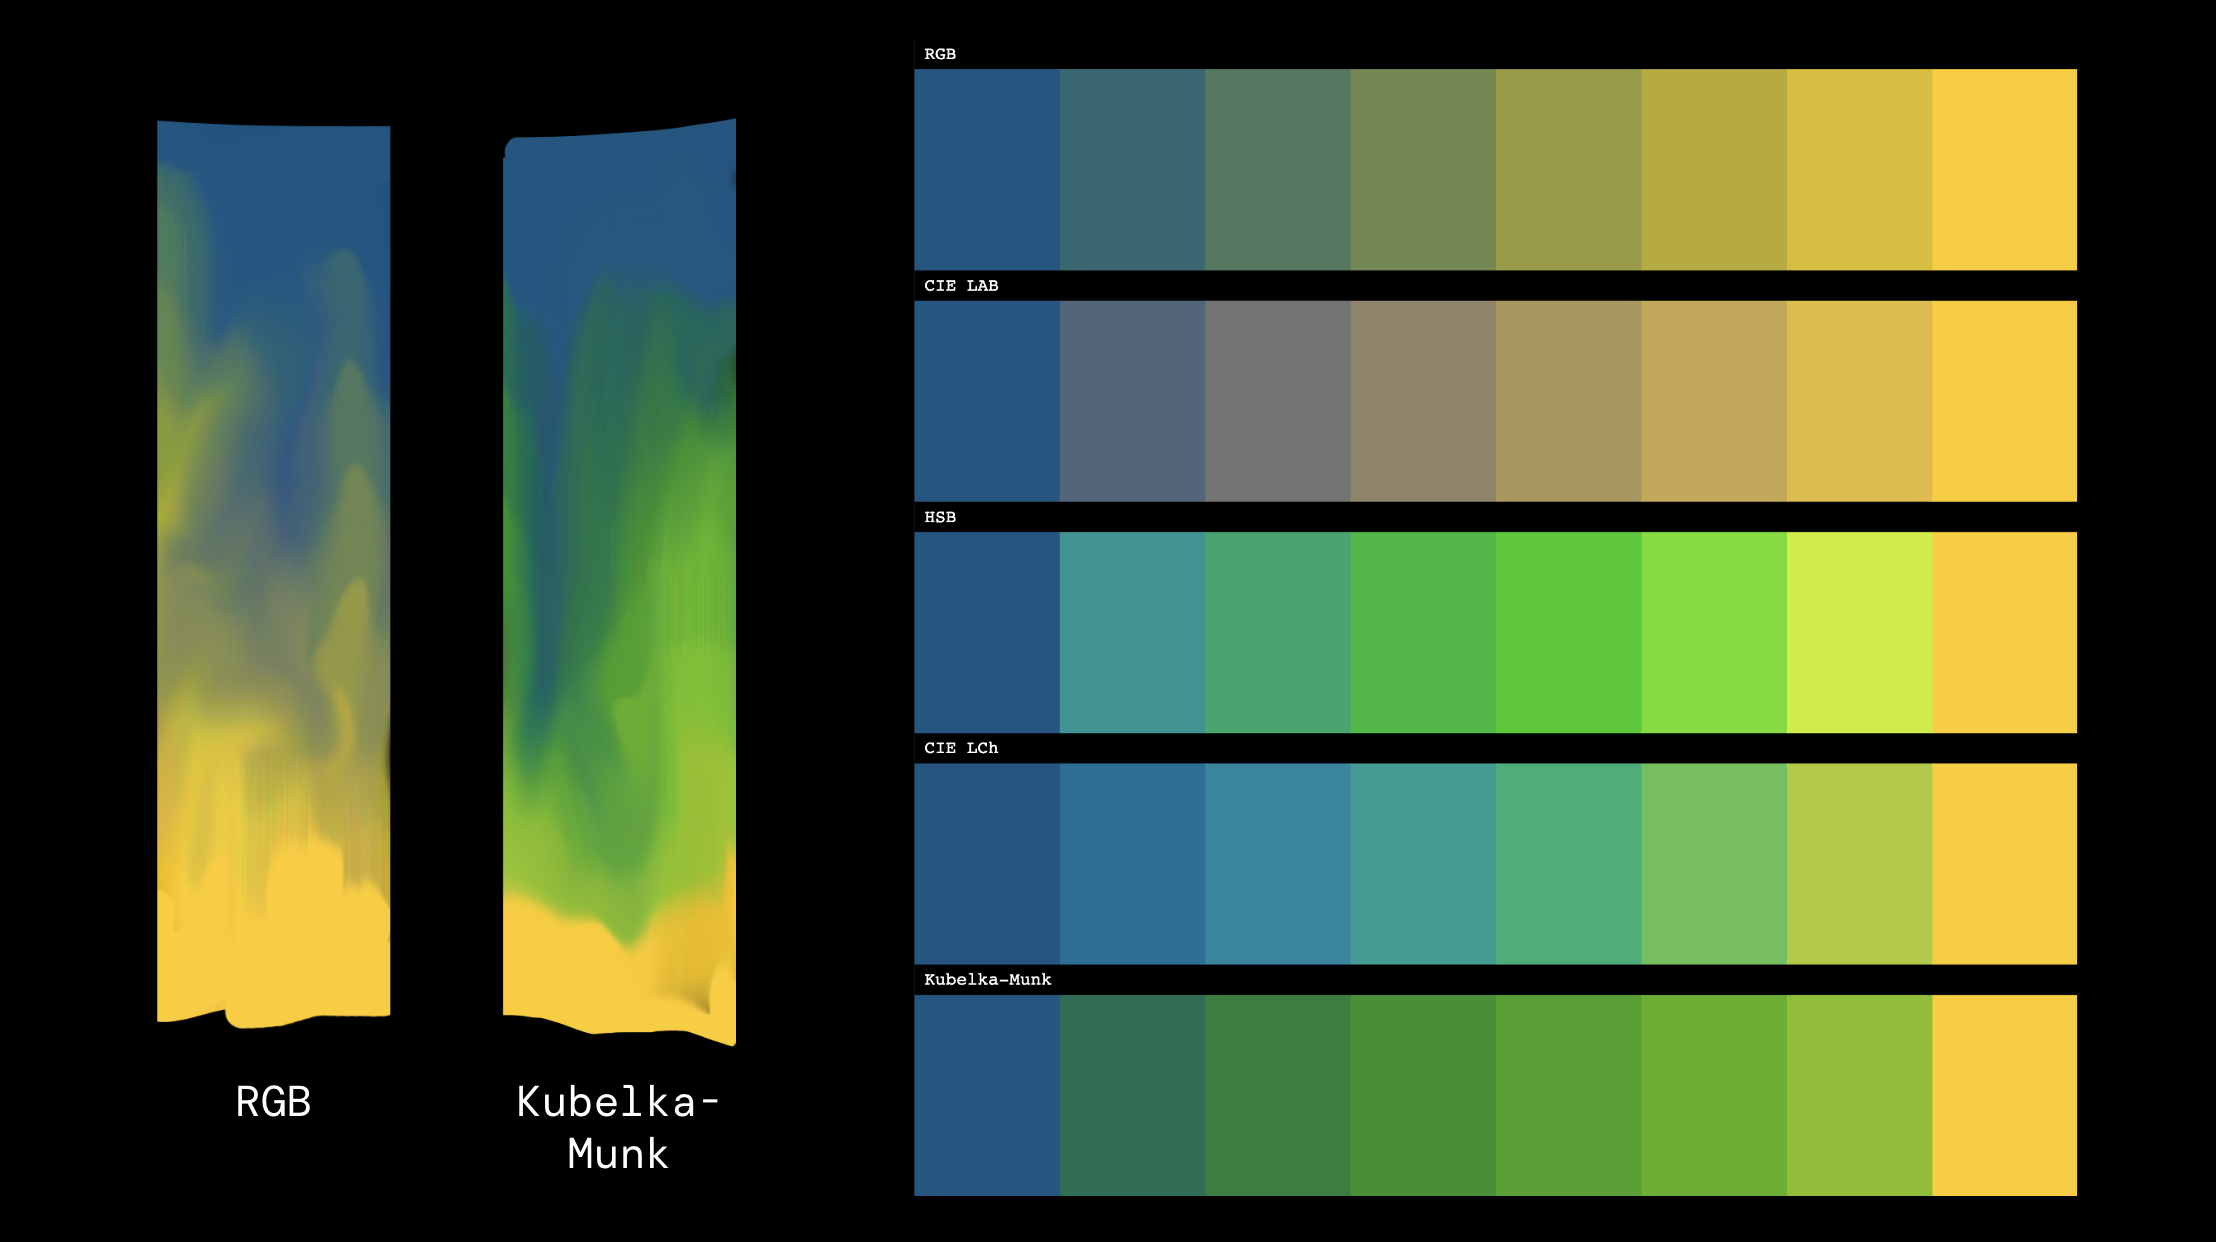
These models allow us to compute colors. For example, we can add, subtract, multiply, or rotate colors. What operations make sense and the results you get vary from model to model, and it is important to select a model for your purpose.
これらのモデルを使用すると色を計算できます。例えば、色の加算、減算、乗算、回転といった操作が可能です。ただし、モデルごとに有効な演算や得られる結果が異なるので、用途に合わせて適切なモデルを選ぶことが重要です。
Being able to process colors to get the desired tone is a critical skill in image and video production.
画像や映像制作において、目的とする色調を実現するための色処理技術は不可欠なスキルです。
Mixing colors is its own deep world. There are so many ways to mix colors. If you are familiar with tools like Photoshop, you probably know there are a bunch of “blending modes” such as add, multiply, screen, overlay, etc. These are different ways to calculate a new color based on the input colors.
色を混ぜ合わせることは、それ自体が奥深い世界です。色を混ぜる方法には様々なものがあり、例えばPhotoshopのようなツールには、加算、乗算、スクリーン、オーバーレイといった様々な「ブレンドモード」が用意されています。これらは入力された色から新しい色を計算するための異なる方法です。
Most of them are defined with RGB color model. Using the other models can yield different results.
これらのほとんどはRGBカラーモデルで定義されています。他のモデルを使うと、違う結果を得ることができます。
Mixing colors in the real world is even more complex, because the color mixing in the real world is the result of various materials reflecting, refracting, and absorbing light. There isn’t a single formula to solve this, but the Kubelka-Munk model is known for emulating real paints consisting of a medium and different colored particles inside.
現実世界での色の混色はより複雑です。実世界での色の混ざり合いは、様々な物質による光の反射、屈折、吸収の結果だからです。この現象を完全に説明できる単一の公式は存在しませんが、クベルカ・ムンクモデルは、媒体と内部の色の粒子からなる実際の絵の具や塗料をシミュレートする手法として広く認知されています。
Light
光
Light striking the retina lets us see colors. To fully understand how colors happen to us, we must understand how light travels from its source to our eyes, bouncing off surfaces while reflecting and refracting along the way.
光が網膜に届くことで私たちは色を知覚できます。色の認識プロセスを完全に理解するには、光源から目までの光の経路を把握する必要があります。その過程では、光は物体の表面で跳ね返り、反射と屈折を繰り返しながら進んでいきます。
Reflection and Refraction 反射と屈折
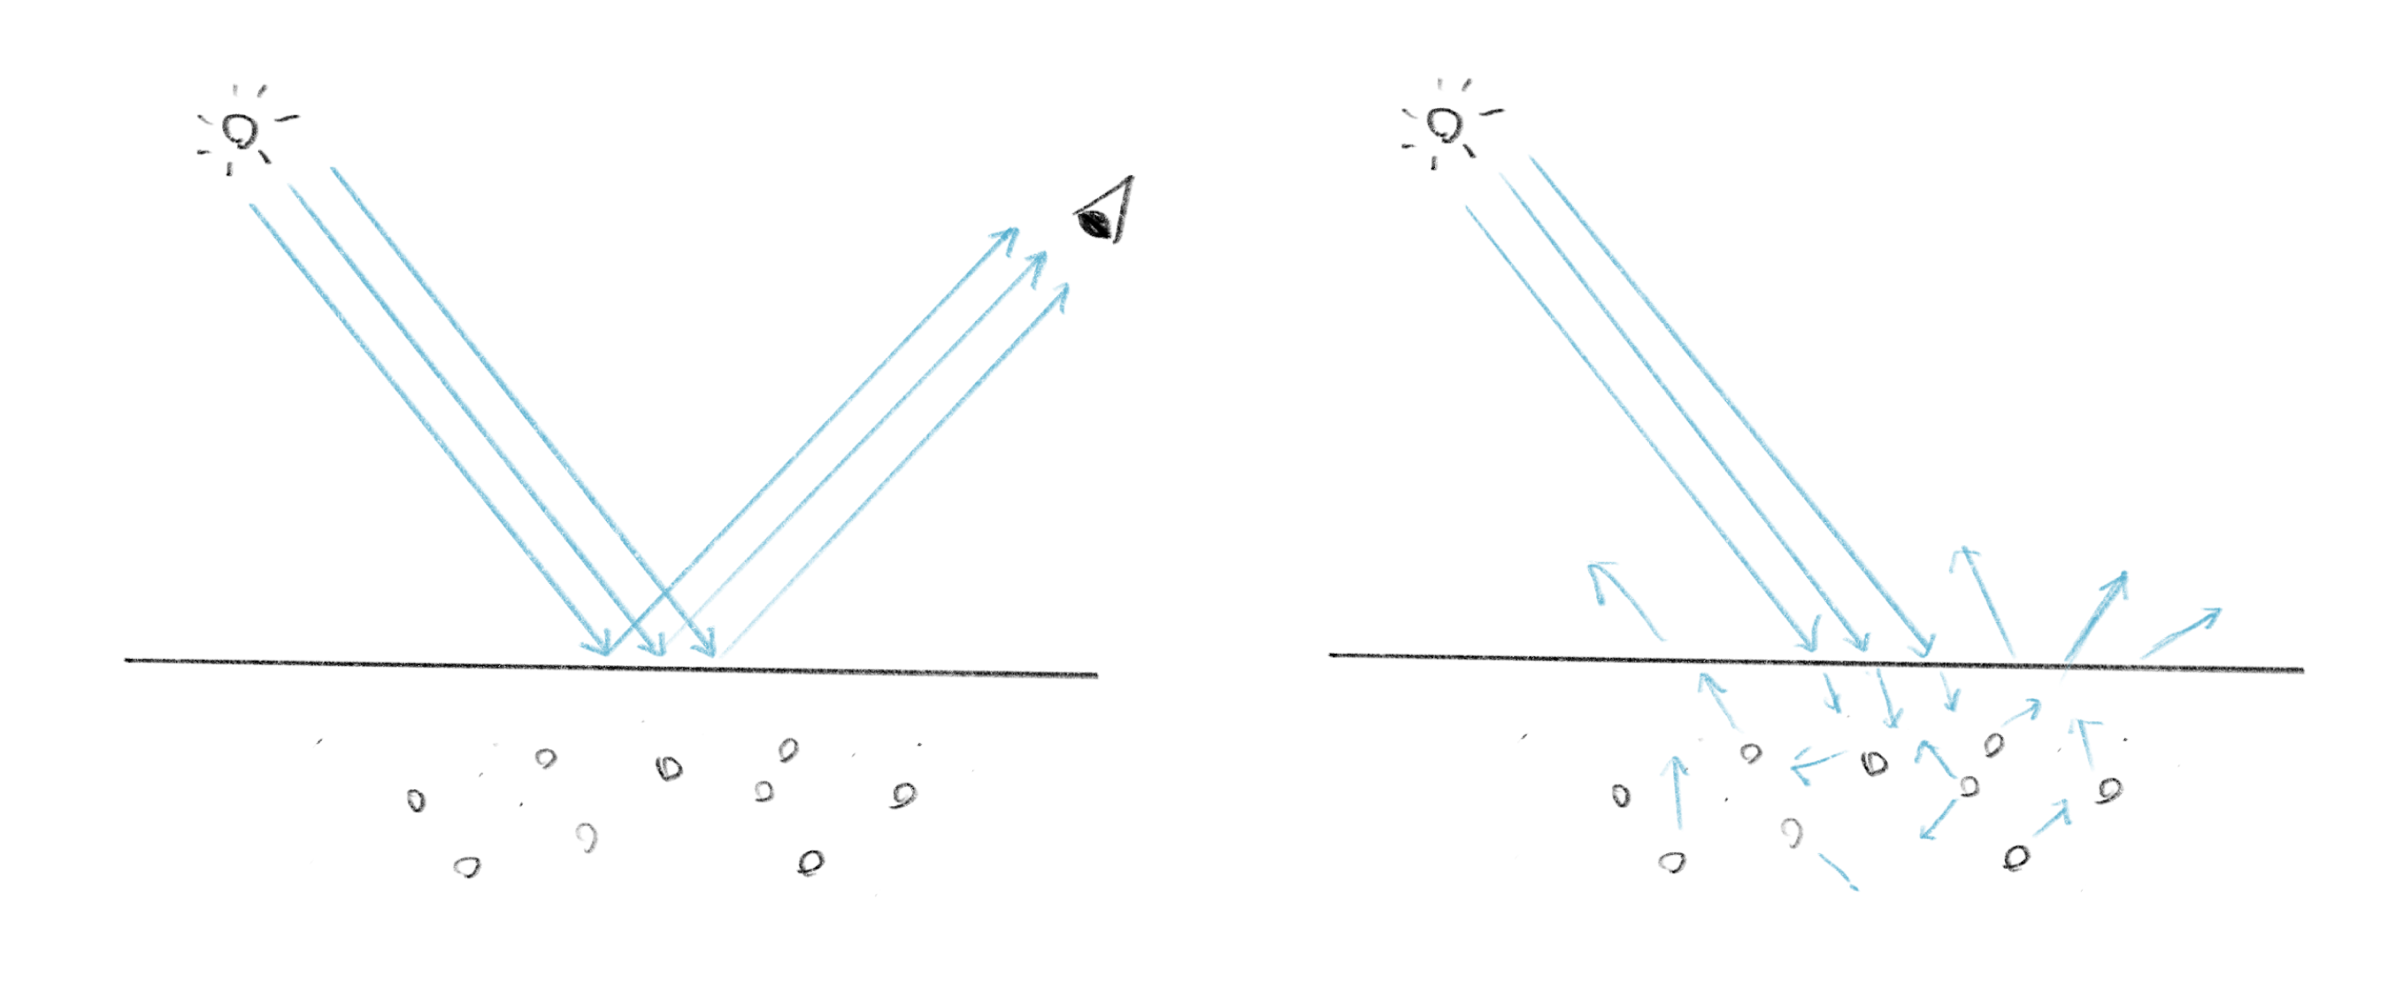
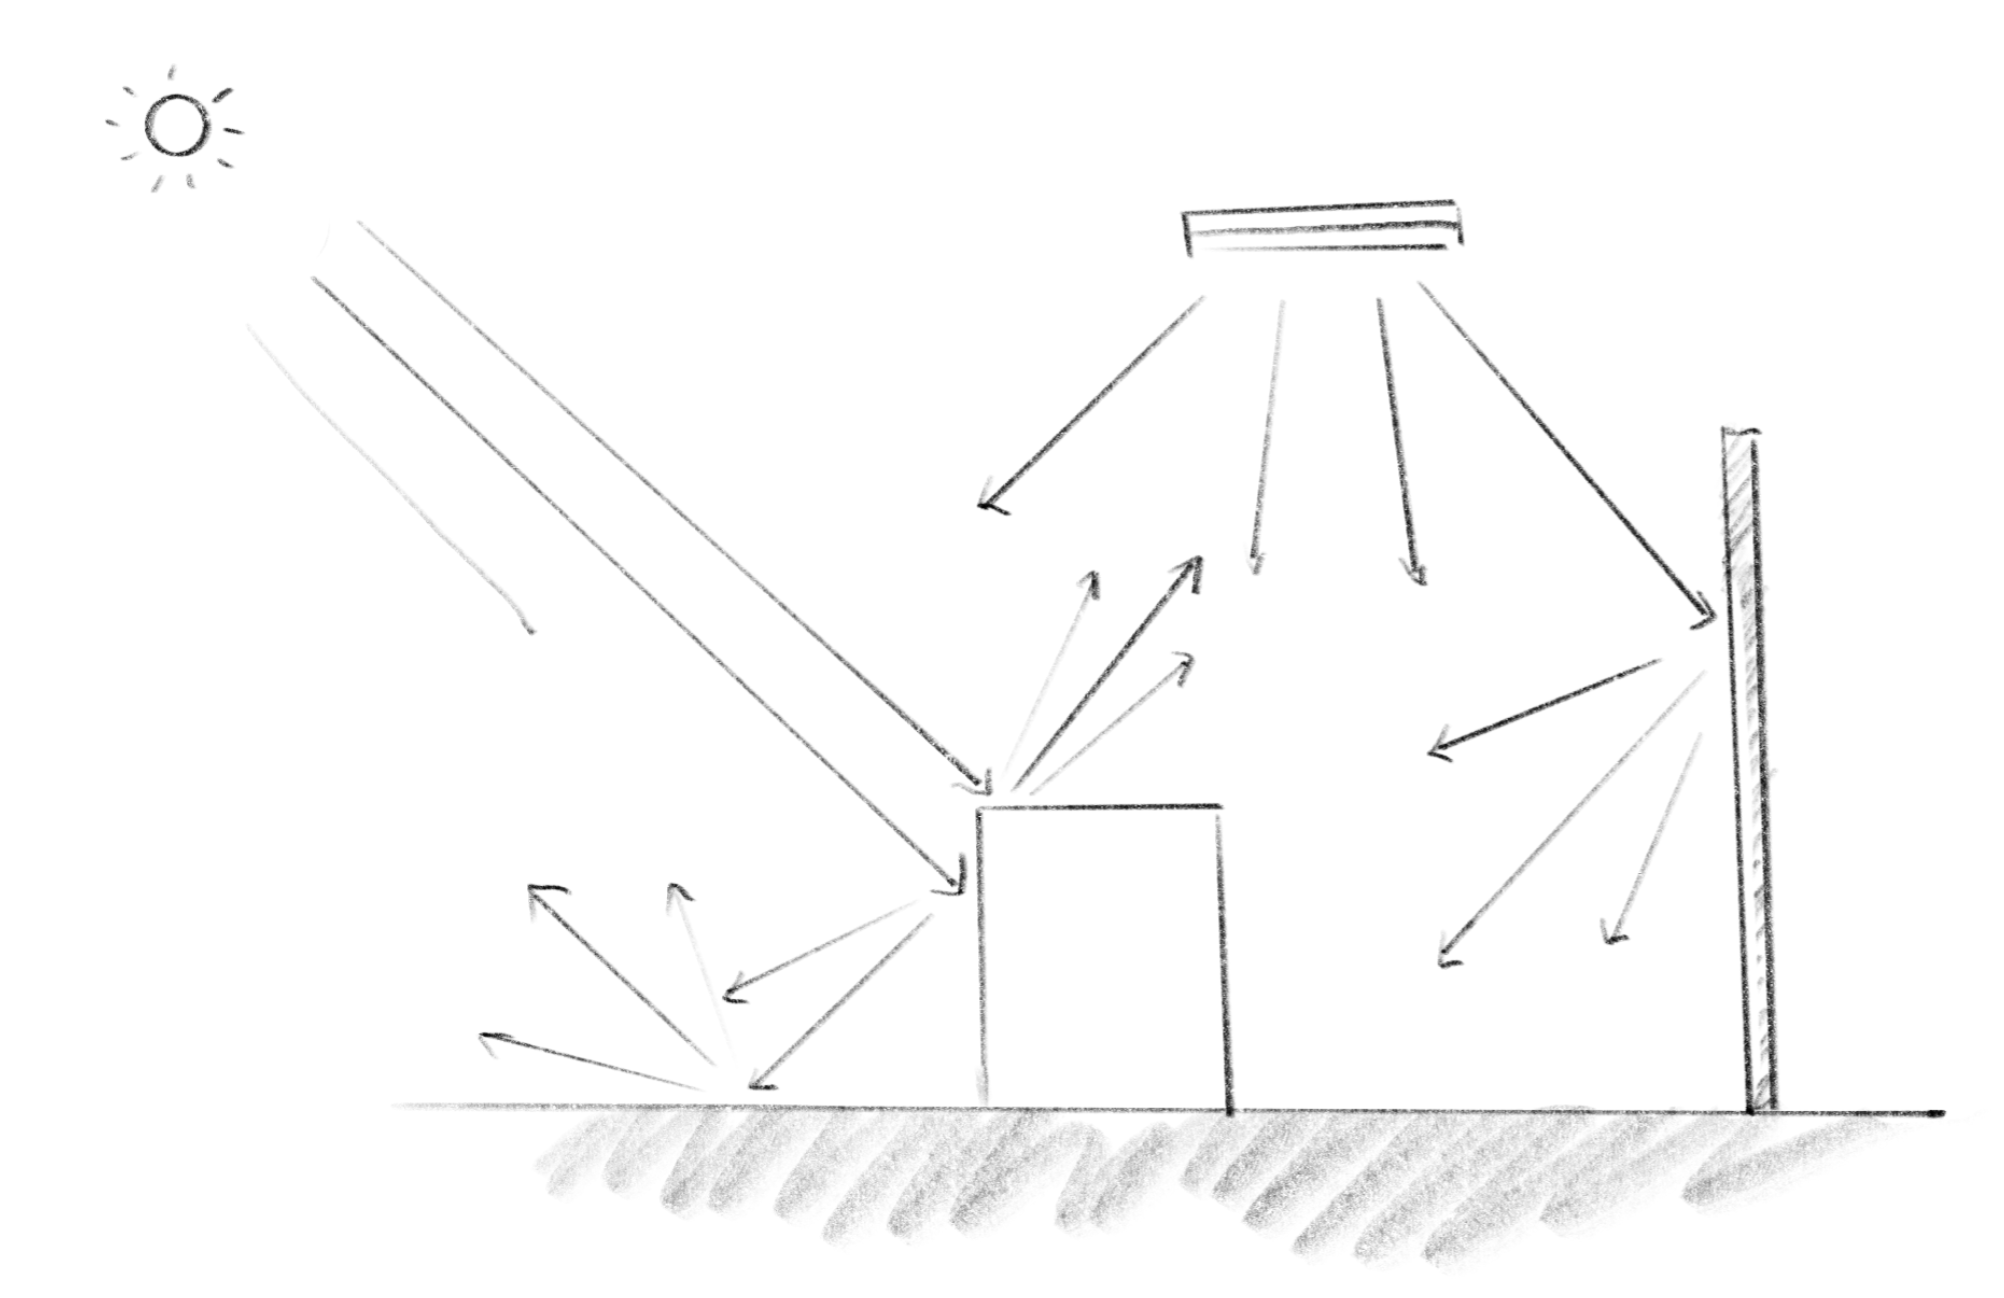
When the light hits an object, the object absorbs some of the light and reflects the others. On transparent objects, some also passes through. Different materials behave differently. If the material absorbs red and yellow spectrums of light more than blue, then the object will look blue. Rough surfaces will scatter the light in all different directions, thus you don’t see clear reflections of other objects on them, while smooth surfaces will mirror the surroundings more clearly.
光が物体に当たると、物体はその一部を吸収し、残りを反射します。透明な物体の場合は、一部の光が透過します。物質によって振る舞いが異なり、例えば青い光より、赤と黄色の光をより多く吸収する物質は、青く見えます。粗い表面は光をあらゆる方向に散乱させるため他の物体の反射がぼやけますが、滑らかな表面はより鮮明に周囲を映し出します。
There are many different methods to simulate this process, from very rough to more accurate approaches. Studying these methods can help you understand how we see colors on objects and better control the colors and appearance of your rendering.
このプロセスをシミュレートする手法には、おおまかなものから精密なものまで、様々な種類があります。これらを学ぶことで、物体の色の見え方についての理解が深まり、レンダリングにおける色や見た目をより効果的にコントロールできるようになります。
Filling Space with Colors
空間を色で満たす
The last section is just an example of using these theories in practice. This installation for KAF Digital space mixes several methods discussed above to fill the space with colors that have the more meditative quality of Fangor’s oil painting, appearing less digital and flashy.
最後のセクションは、これらの理論を実践で使った例です。KAF Digital spaceのために制作したこのインスタレーションでは、上述した複数の手法を組み合わせ、ファンゴルの油絵が持つような瞑想的な質を作り出し、デジタルっぽさを抑えた色彩で空間を満たしています。