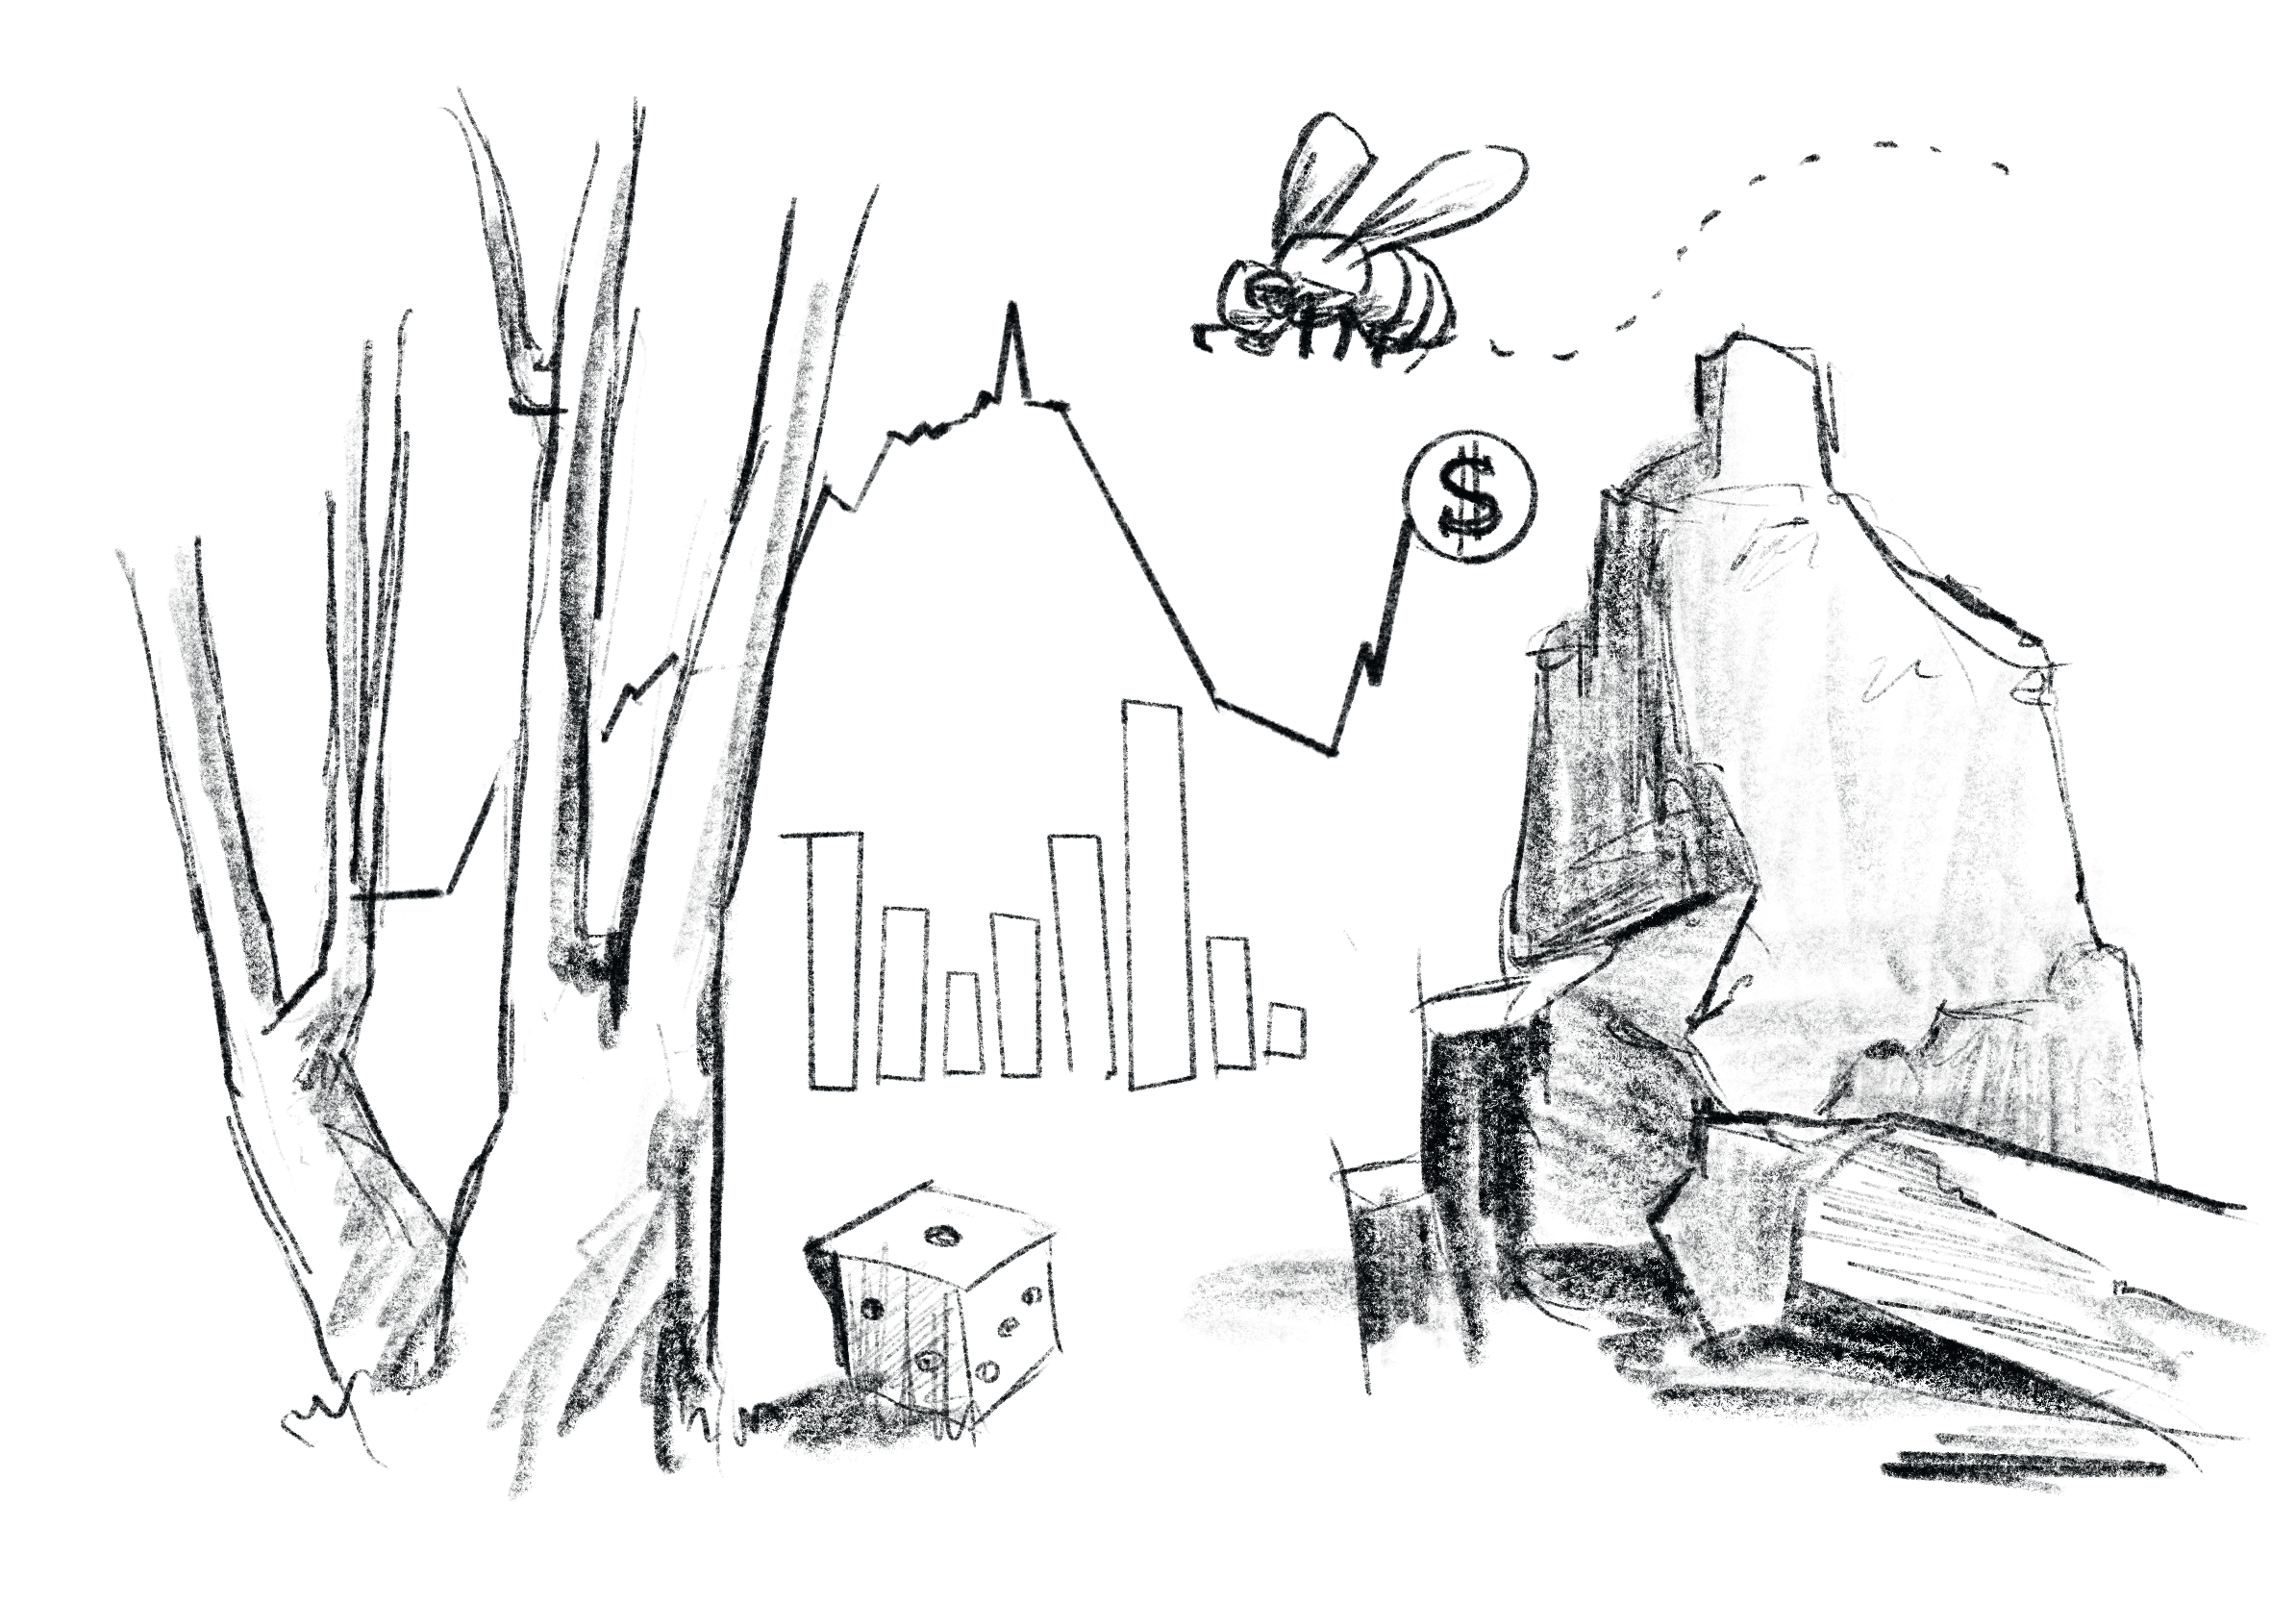
Taming Randomness ランダムさを手なづける
Dice rolls, stock prices, human behavior, plants and animals, mountains and rivers, the shape of buildings and cities, the world is full of unpredictable things and countless variations. To handle such a kind of nature and complexity in computers, we often use random numbers
サイコロや株価、人の行動、動植物や山や川などの地形、建物や街の形、世の中は予測できないものや無数のバリエーションで溢れています。コンピュータでこうしたある種の自然さ、複雑さを扱うためには乱数がよく用いられます。
Simple random function
単純なランダム関数
Let’s start with a simple random function. Actually, it is not possible to generate perfectly random numbers with a computer, but most languages and environments provide pseudo-random functions with sufficient quality. If a function is not available, for example in GLSL, you can use well-known methods such as those described in The Book of Shaders.
まずは単純なランダム関数から始めましょう。実はコンピュータで完全な乱数を発生させることはできないのですが、大抵の言語や環境には十分な性能の疑似乱数が用意されています。GLSLなど、そのような機能が用意されていない場合には The book of shaders に載っているようなよく知られた方法を使うこともできます。
A simple random function here refers to one in which every value occurs at approximately the same probability.
ここでいう単純なランダム関数とは、どの値もほぼ同じ確率で発生するようなものを指します。
Take a look at the sample below. This example uses p5.js’s random() function to generate random numbers between 0 and 1, and graphs the occurrences of the values. The vertical bars are in increments of 0.01, with the left end corresponding to the occurrences of the numbers greater than 0.00 and less than 0.01, and the next to that greater than 0.01 and less than 0.02, and so on. The height is adjusted so that the bar with the highest number occupies the full length.
Despite some unevenness, you can see that all numbers occur with roughly the same probability.
下のサンプルを見てみましょう。この例ではp5.jsのrandom()を使って0から1までの数値をランダムに発生させ、値の出現回数をグラフにしています。縦棒は0.01刻みで、左端は0.00以上から0.01未満の間の数が発生した回数、その次は0.01以上、0.02未満に対応しています。高さは最も発生回数が多い棒が縦いっぱいになるように調整されています。
凸凹がありながらも全ての数が大体同じ確率で発生しているのがわかります。
let v = random(1);
While such flat random numbers are useful for representing dice, playing cards, etc., there are not many things in nature that are purely random.
このようなフラットな乱数はサイコロやトランプのカードなどを表現するのには便利ですが、自然の世界では単純にランダムな物事はそう多くありません。
Biasing random numbers
乱数に偏りを持たせる
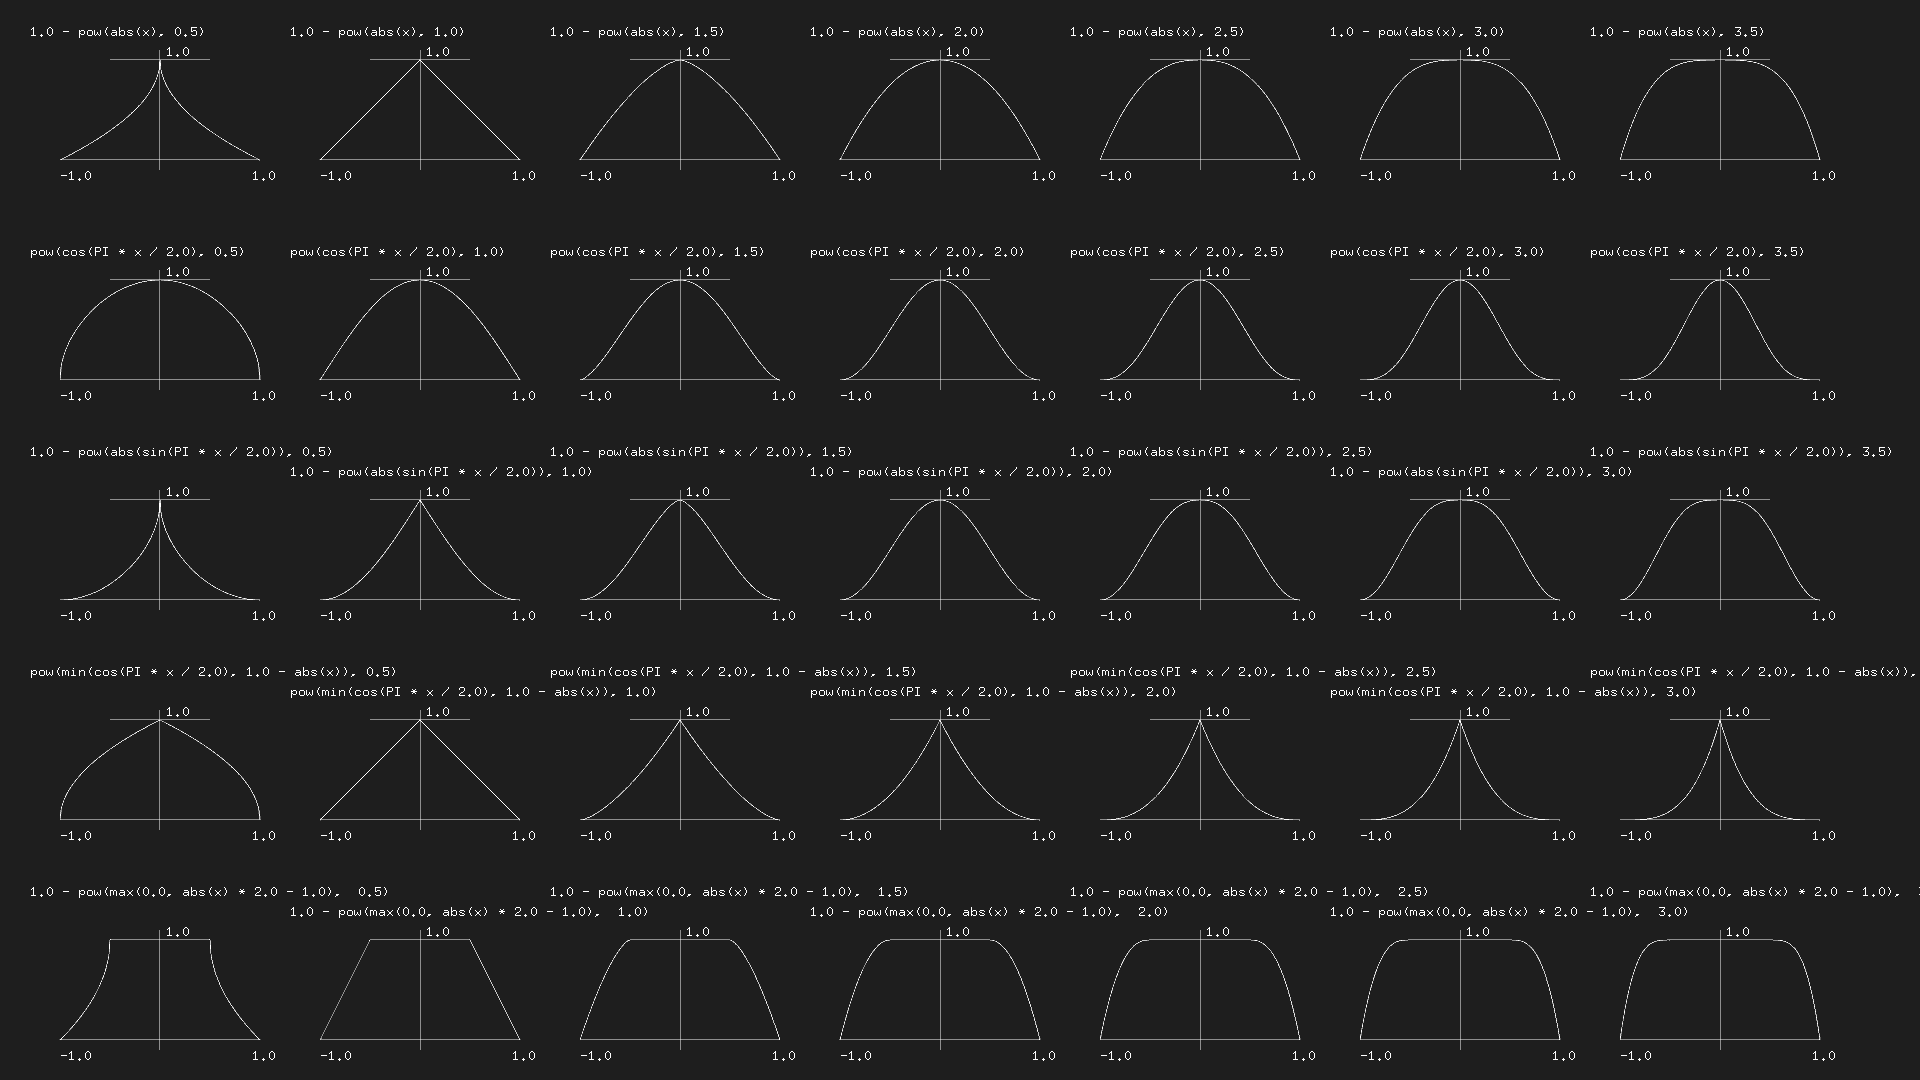
Let’s add a little twist to the random numbers. For example, simply squaring a flat random number can bias the probability like this.
ちょっとした工夫をして乱数にクセを加えてみましょう。例えばこのようにフラットな乱数を2乗するだけで、確率に偏りを出すことができます。
let v = pow(random(1), 2);
Try powers of other than 2 as well.
2以外の冪乗も試してみましょう。
let v = pow(random(1), n);
Can you see the difference between these two cityscapes?
この2つの街並みの違いがわかるでしょうか。
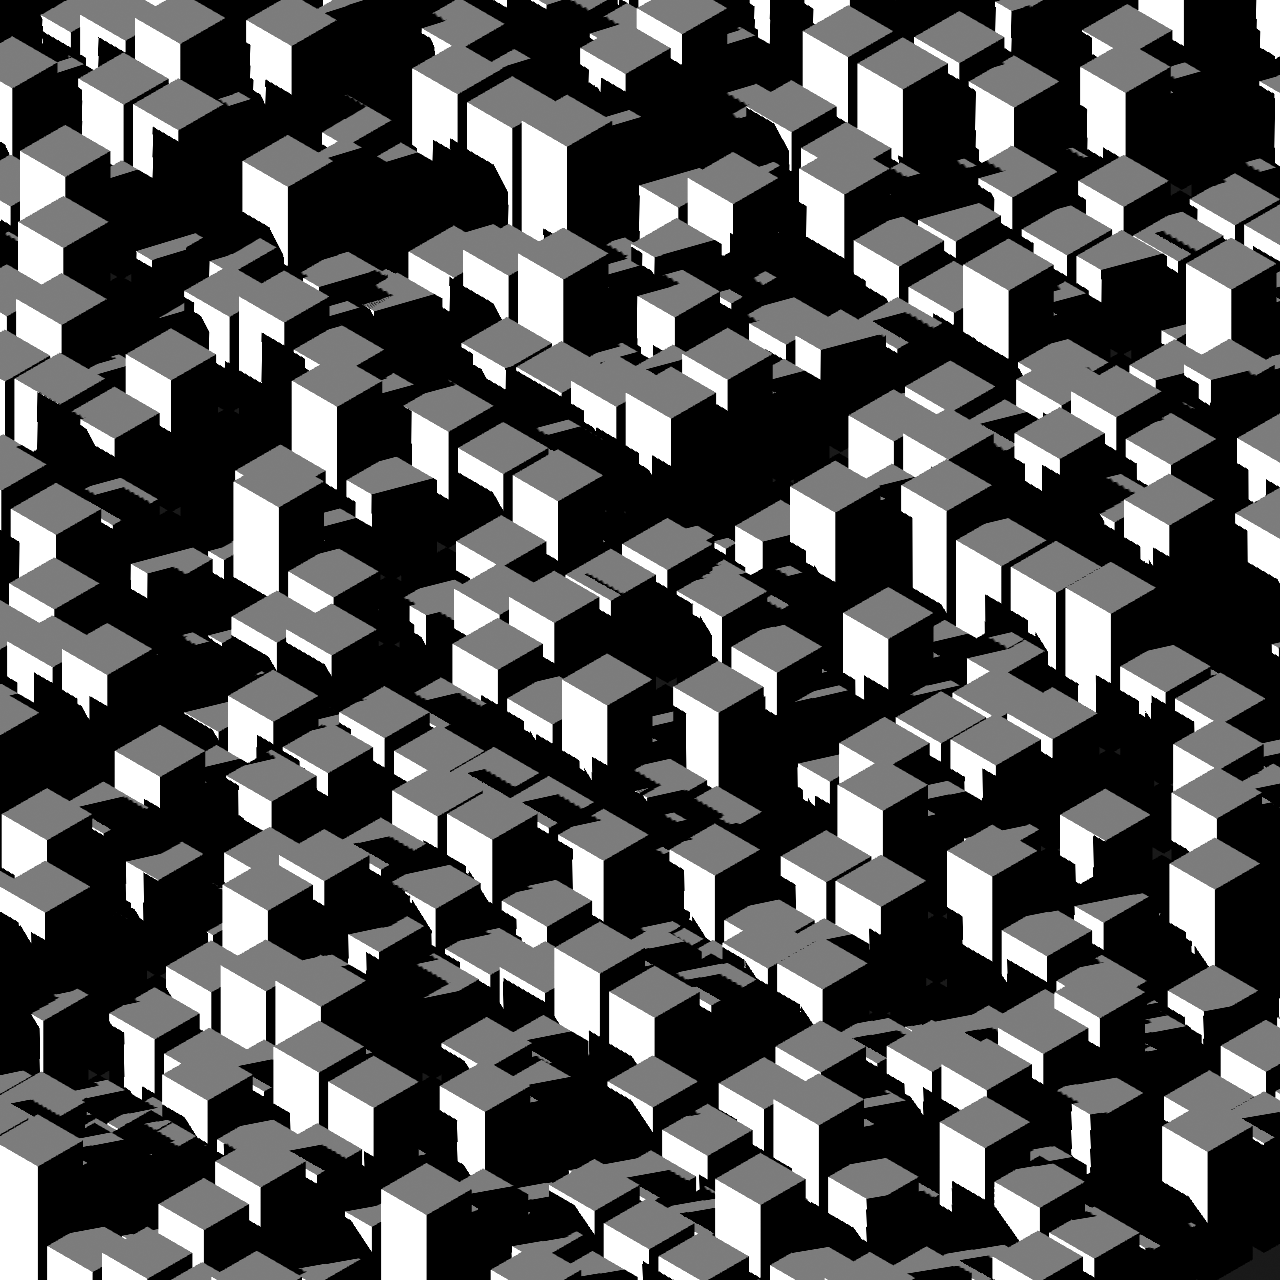
height = random(1) + 0.1
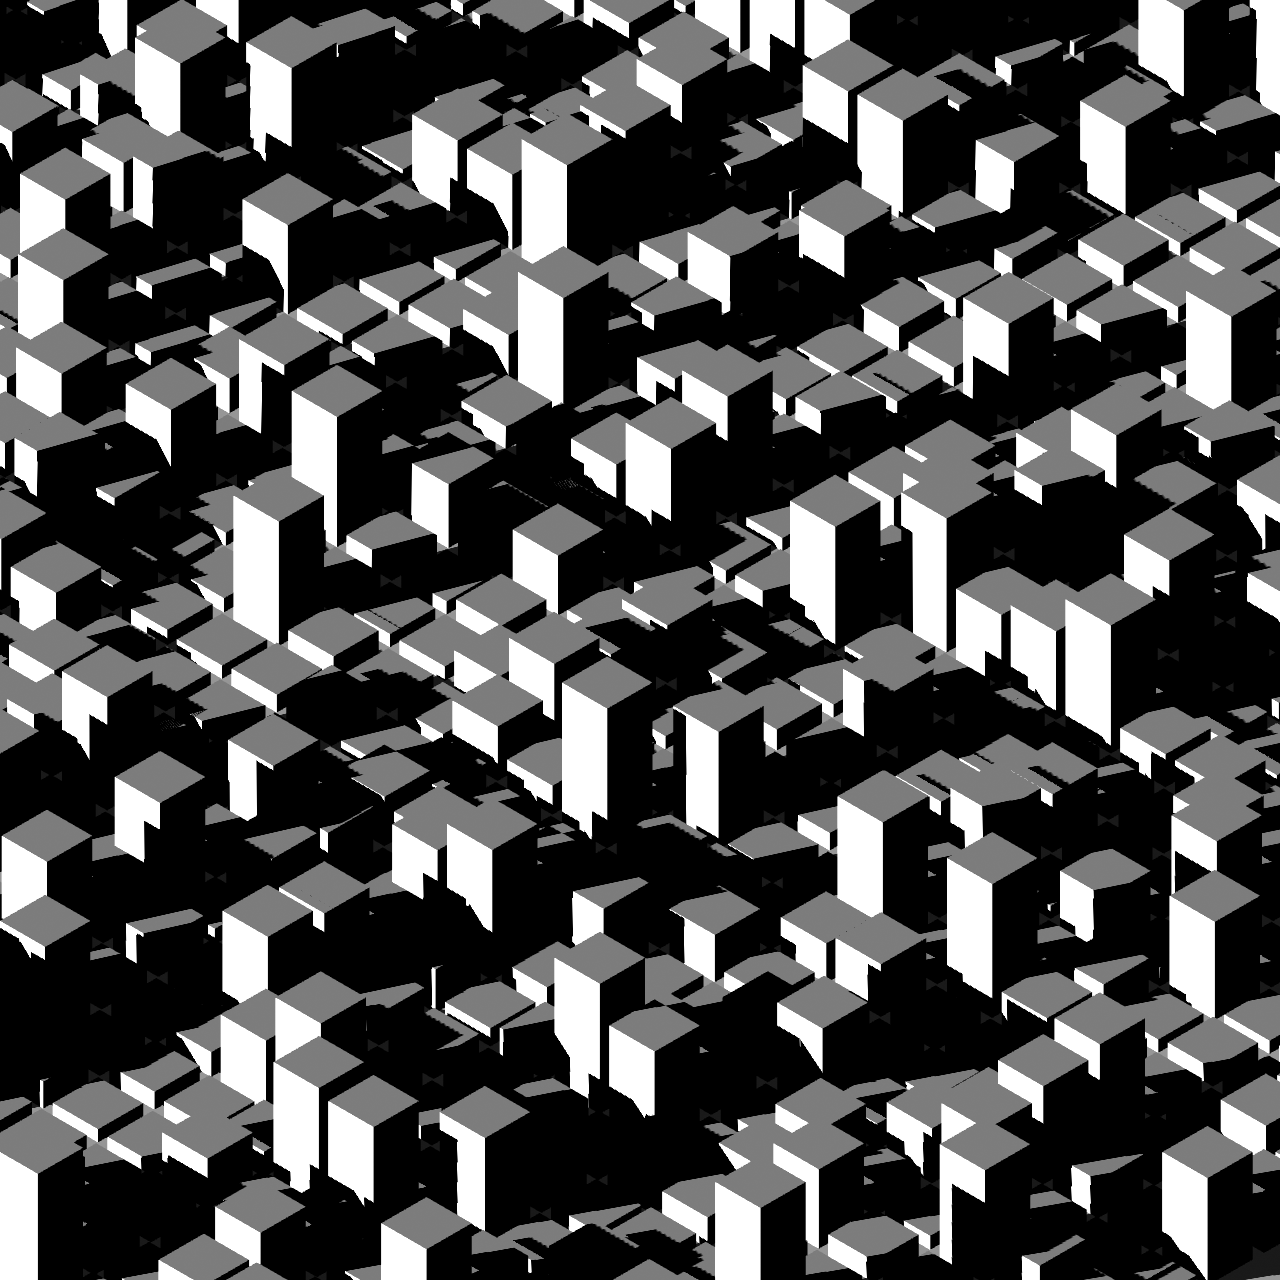
height = pow(random(1), 4) + 0.1
Not only exponents, various other functions can be used for creating different biases.
冪乗以外にも様々な関数が異なる偏りを作り出すのに役に立ちます。
https://www.flickr.com/photos/kynd/9546075099/
The average of random numbers and normal distribution
乱数の平均と正規分布
Alternatively, averaging two random numbers can yield a distribution biased toward the center.
あるいは乱数を2回発生させてその平均をとると中心に偏った分布が得られます
let v = (random(1) + random(1)) / 2;
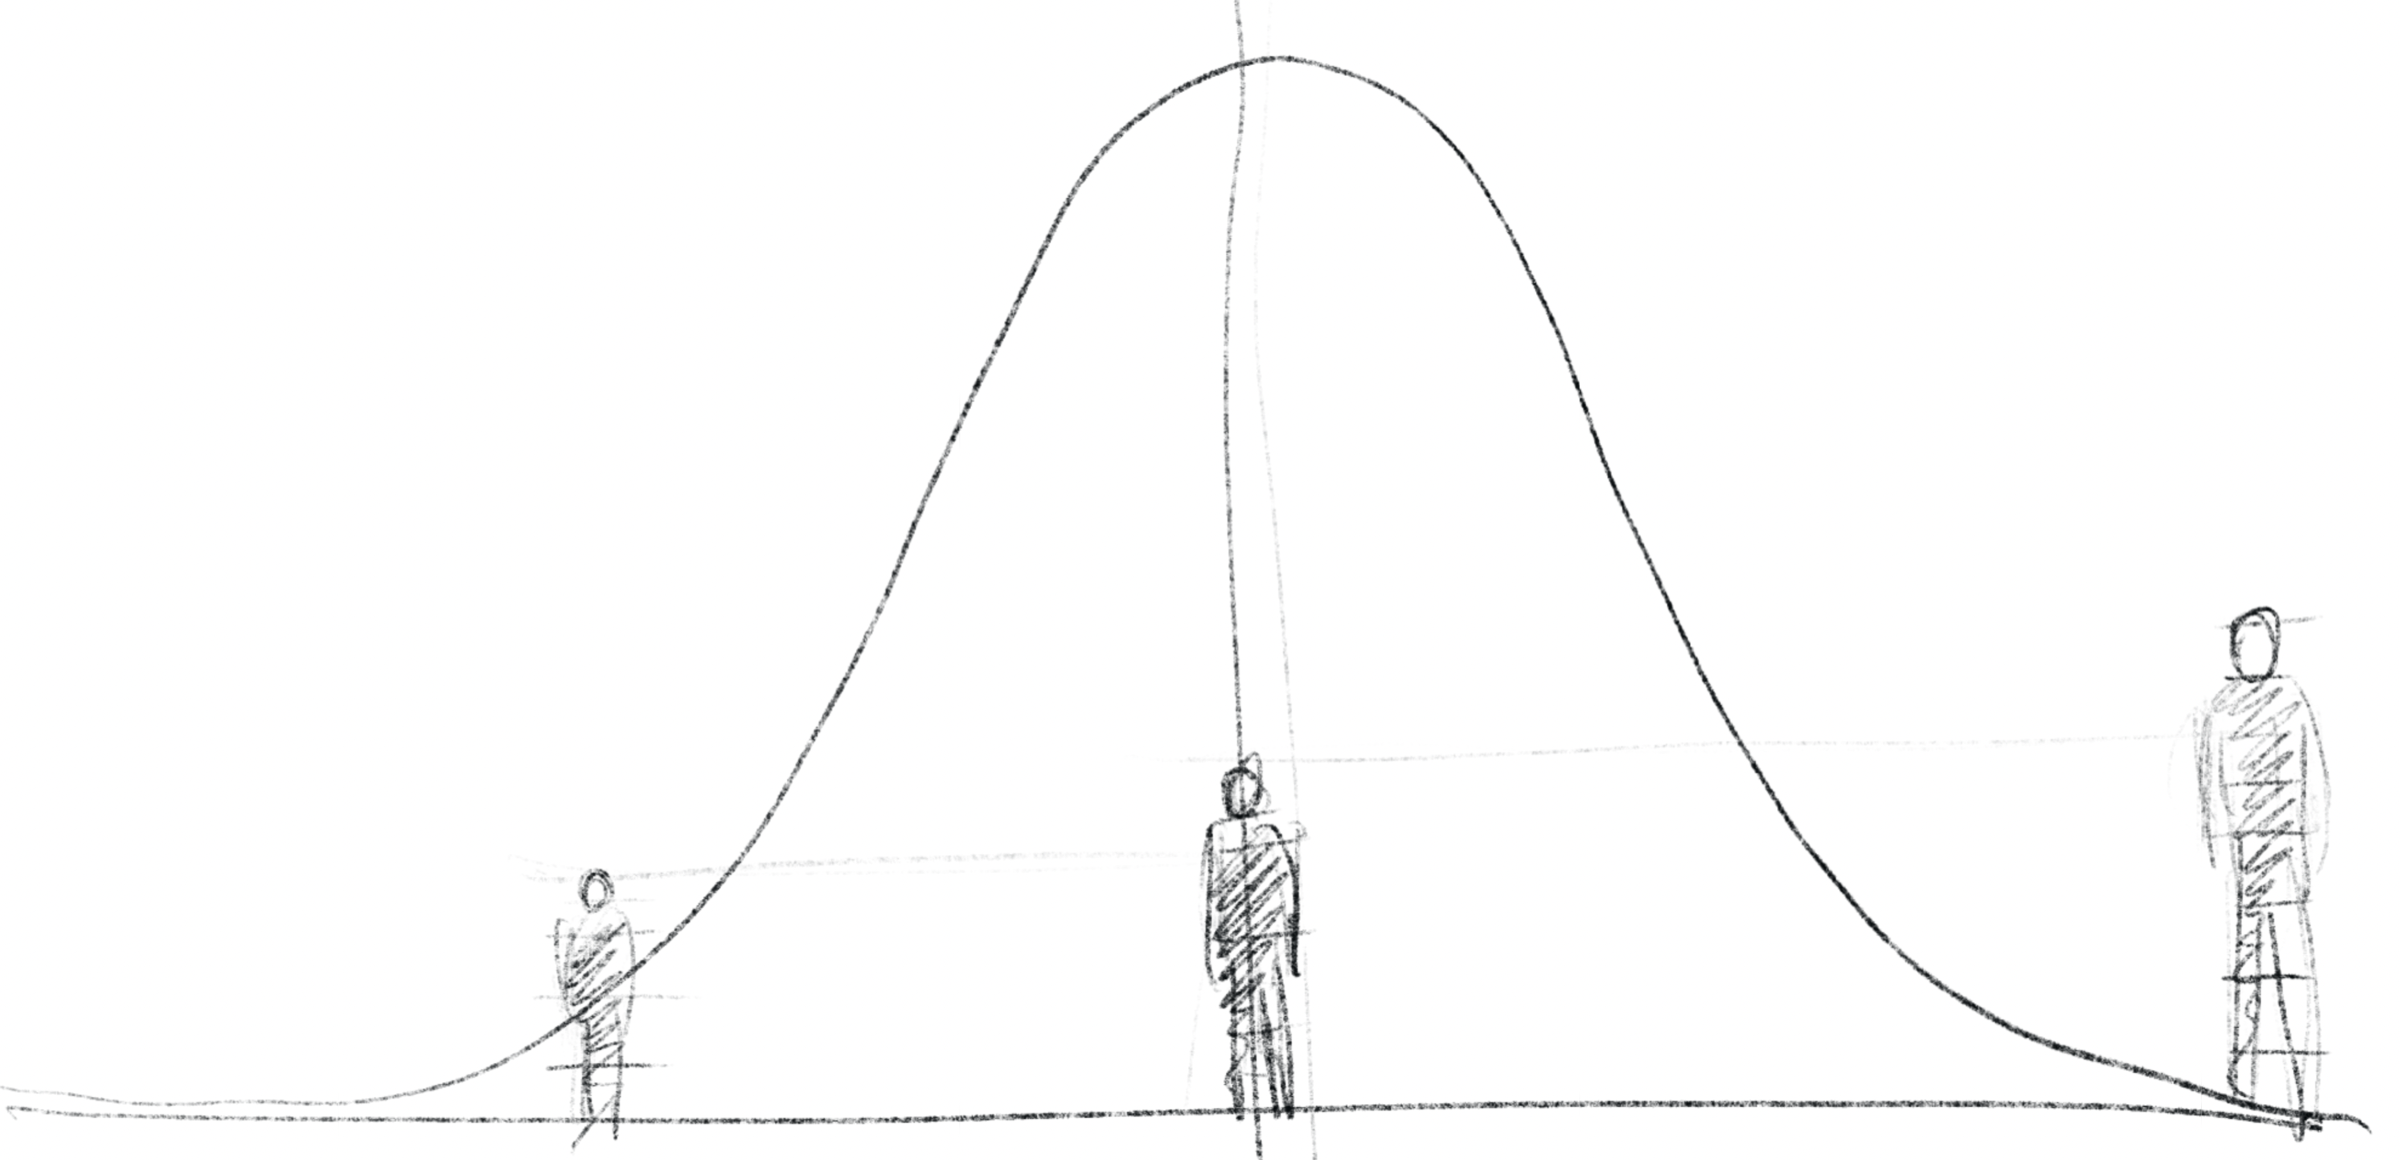
If we increase the number of random results for averaging, it starts to resemble a bell-shaped distribution called a normal distribution.
平均を取る乱数の数を増やしていくと正規分布と呼ばれるベル型の分布に近づいていきます。
let v = 0;
for (let i = 0; i < n; i ++) {
  v += random(1);
}
v /= n;
The normal distribution, also called Gaussian distribution, is used as a model in statistics, natural science, social science, and other fields. Cases with many values near the mean and few outliers can be found in a variety of situations. For example, normal distribution can be used to determine the height and body size of a randomly generated crowd of people.
正規分布はガウス分布とも呼ばれ、統計学や自然科学、社会科学などの分野でモデルとして用いられています。平均の周辺の値が多くて飛び抜けた値ほど少なくなるケースは様々な場面で見られ、例えば群衆をランダムに生成する場合に身長や体格を決めるのに使うことができます。
Repeating a random function is inefficient, so let’s use a method called the Box-Muller transform to convert a random value to a normal distribution. In fact, normal distribution is often implemented in libraries, for example, p5.js can use randomGaussian().
ランダム関数を繰り返すのは効率が悪いので、ボックス=ミュラー法という手法を使ってランダムな値を正規分布に変換してみましょう。実際には正規分布もライブラリなどで実装されている場合が多く、例えばp5.jsならrandomGaussian()を使うことができます。
// Box-Muller Transform (Unif(0,1) => N(0,1))
// avoiding log(0) by using (1 - random(1))
let mean = 0.5, variance = 0.1;
let v = sqrt(-2 * log(1 - random(1))) *
             cos(2 * Math.PI * Math.random(1)) * variance + mean;
Noise function
ノイズ関数
Dice have no memory. The previous roll has no bearing on the next number. You can’t say, “I rolled 1 three times in a row, so it must be 1 next time too.” All numbers should roll the same number of times. The next number will be 1 because there were not so many 1s today.
サイコロには記憶がありません。直前の出目は次の数には全く関係ないので、「3回1が続いたから次も1だろう。」「全ての数が同じ回数出るはずだ。今日は1があまり出ていないので次はきっと1だ。」などと言うことはできません。
What if we want more continuous values? For example, the up and down of a terrain, the change of the temperature, or the direction an animal wanders toward are all unpredictable, but they look smoothly connected, or the values next to each other seem to be somehow related.
ではもっと連続的な値が欲しい場合はどうすれば良いでしょう。例えば地形の凹凸、気温の変化、動物が進む方向などは予測不可能だけれど前後が滑らかに繋がっていたり、値どうしが互いに関係があるように見えます。
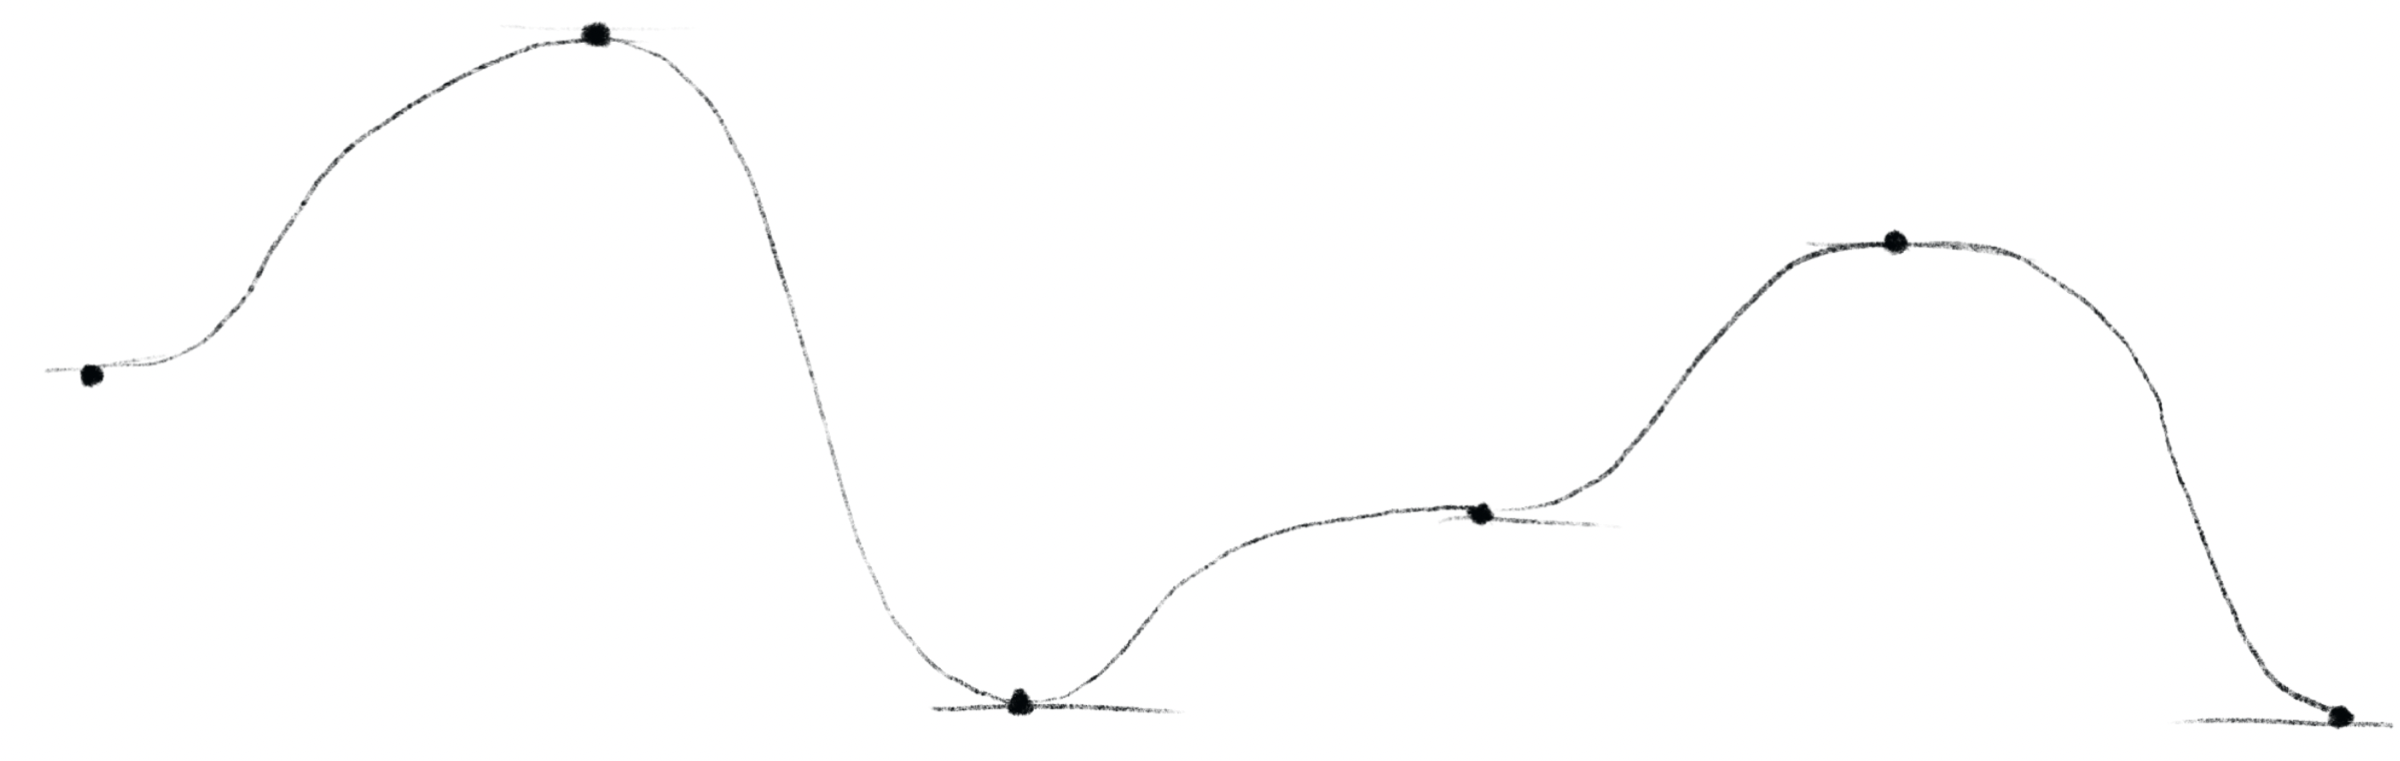
An easy way is to generate multiple random numbers and smoothly interpolate between them. This is called value noise.
簡単な方法の1つは複数の乱数を生成してその間を滑らかに補間することです。この手法は値ノイズ(value noise)と呼ばれます。
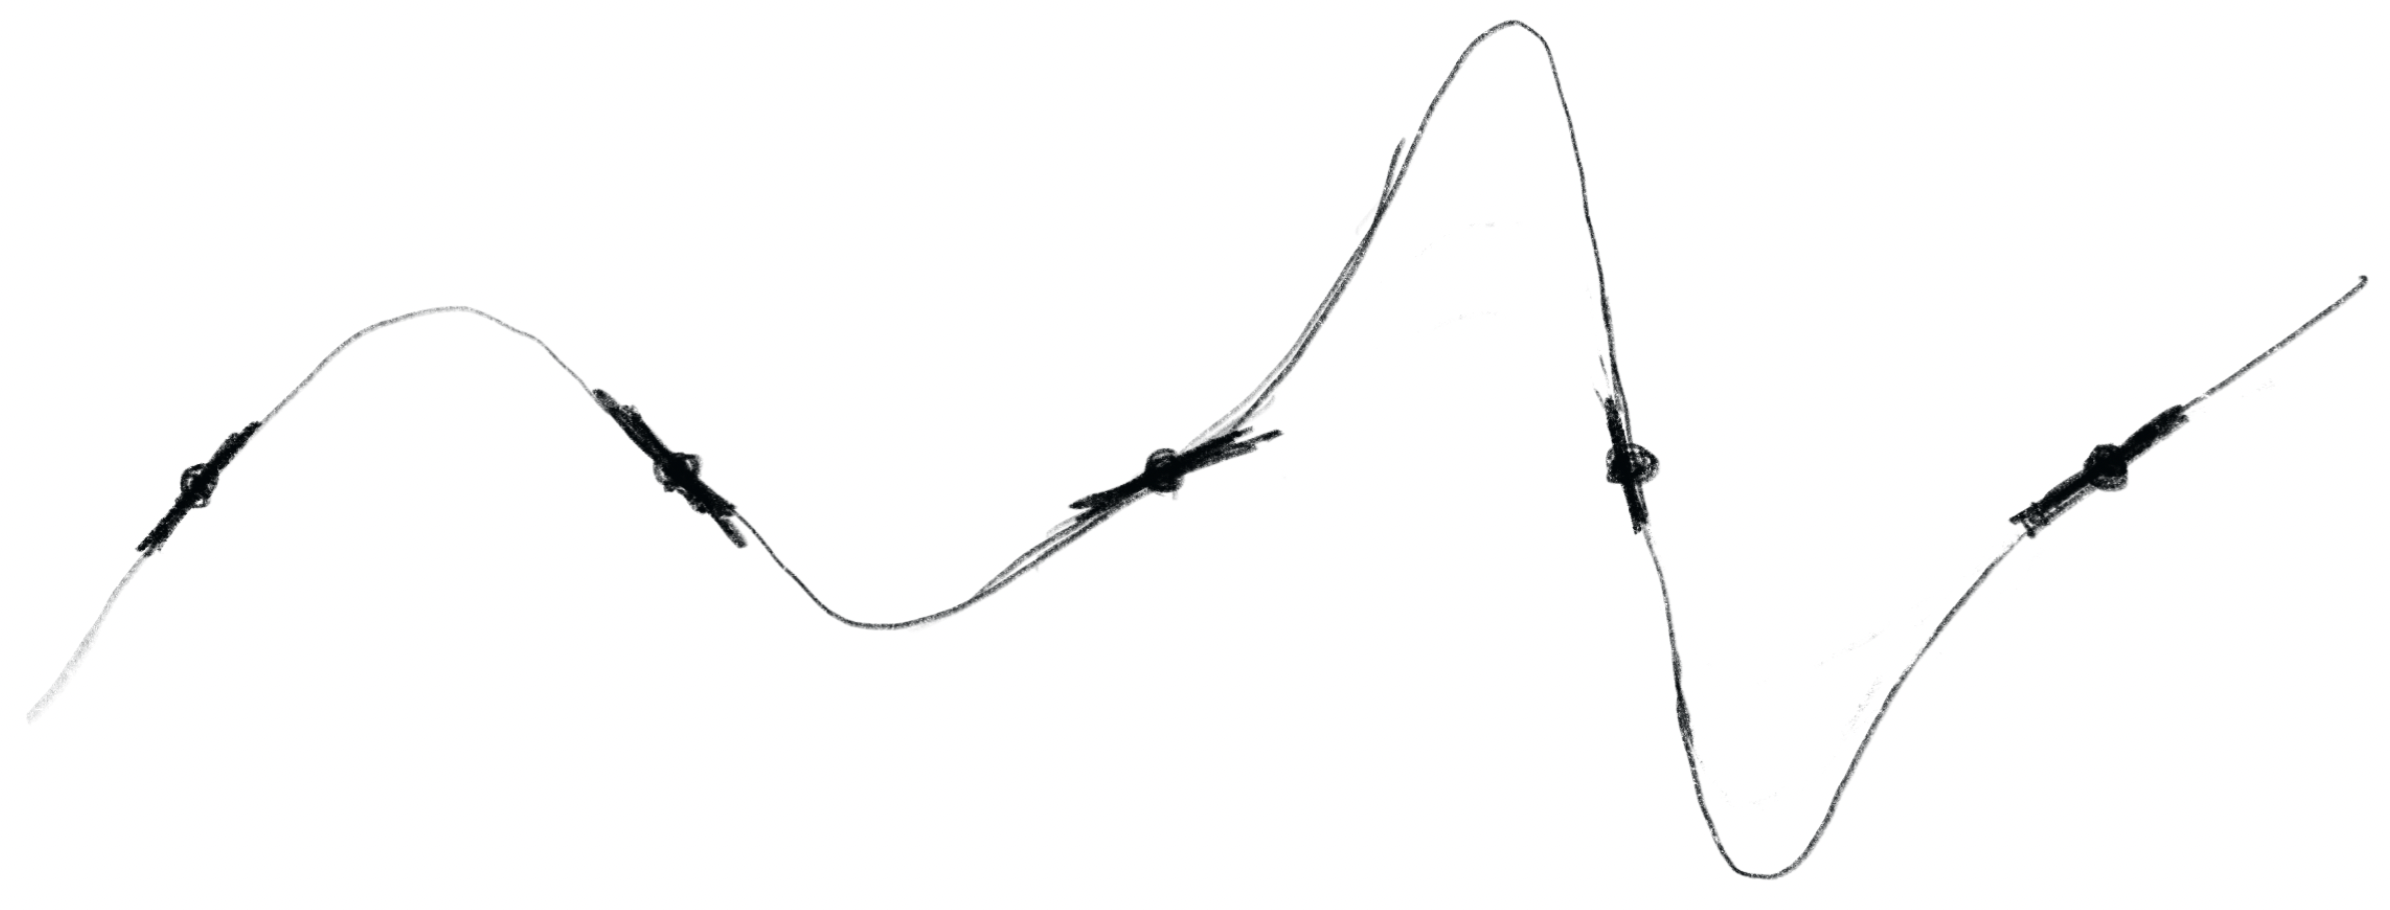
Another method called gradient noise uses random numbers as the amounts of changes, or slopes, instead of using random numbers as direct values.
勾配ノイズ(gradient noise)と呼ばれる別の手法では、乱数を直接の値として使うのではなく、変化量、傾きとして使います。
There can be so many various ways depending on the purpose, such as changing the method of interpolating values, or the interval at which random numbers are taken, and so on.
値の補間の方法を変えたり、乱数を取る間隔も変化させたりと、目的に応じて色々と考えることができます。
These methods are so useful that many researchers have come up with a variety of algorithms especially for computer graphics. You may have seen menus in 3D tools to select different types of “noise” such as Perlin noise or Simplex noise.
こうした手法は非常に便利なので、特にコンピュータグラフィクスの分野で多くの研究者が様々なアルゴリズムを考え出しています。3Dツールで、パーリンノイズやシンプレックスノイズといった異なるタイプの「ノイズ」を選ぶメニューを見たことがあるかもしれません。
Let’s take a look at the noise() function in p5.js. The example below calls noise() every frame and arranges the values horizontally. It looks like nice gentle mountains.
p5.jsのnoise()関数を見てみましょう。下の例では毎フレームごとにnoise()を使って値を発生して横に並べています。なだらかな山の稜線のように見えます。
let v = noise(x); x += 0.01;
If you want more jagged ridges, you can add overlapping noises with different speed of change and amplitude. This is sometimes called “octave” because (I think) it resembles to sound overtones.
もっとギザギザな稜線が欲しければ変化の速さや大きさの違うノイズを重ね合わせることもできます。これは(たぶん)音の倍音に似ているので「オクターブ」と呼ばれることもあります。
let v = noise(x) + noise(x * 4.0) * 0.5;
  x += 0.01;
This is just a side note, but instead of using random numbers in the gradient noise, applying regular value changes can create an interesting motion like this. The algorithm was originally designed to create unpredictable patterns, but it does not have to be used as intended.
これは余談ですが、勾配ノイズでランダムな数を使う代わりに規則的な値の変化を用いるとこんな動きになります。元々は予測不能なパターンを作るためなアルゴリズムですが、意図通りに使わなくてはならないということはありません。
Random Walker
ランダムウォーカー
A random walker is literally a thing that wanders around, deciding its movements based on randomly generated values. Comparing random walkers made with the methods we have looked at so far can clearly highlight the differences between them.
ランダムウォーカーとは文字通り、ランダムに生成した値を元に動きを決めて、ふらふら歩き回るもののことです。これまで見てきた手法を使ってランダムウォーカーを作って比べてみると、それぞれの違いがはっきりわかります。
A fun part of sketching in code is the trial-and-error process of combining various techniques to get the flavor and nuance you want. Let’s try controlling the randomness to create different kinds of behaviors.
コードでスケッチする楽しみの1つは様々な手法を組み合わせて自分の欲しい味わいやニュアンスを出すために試行錯誤することです。ランダムさをうまくコントロールしてどんな振る舞いが作れるか色々試してみましょう。