What is Randomness? ランダムさとは
We’ve discussed that chaos refers to phenomena following deterministic rules that nonetheless appear random and unpredictable over time. But what does it actually mean to be random or unpredictable?
カオスとは、決定論的なルールに従いながらも、長期的にはその挙動がランダムに、予測不能に見える現象のことでした。しかし、ランダムである、予測不能であるというのはどういうことでしょう。
Intuitively, randomness means we cannot predict the future even with all available information. For example, when you release a die in mid-air, Newtonian mechanics can predict its direction and speed as it falls. But it still seems impossible to predict which face lands up after it bounces on the floor.
直感的に考えるとランダムであるということは、今現在わかっている情報を元にしても未来の予想ができないことだと考えられます。例えば空中でサイコロから手を離した時にサイコロが落ちていく向きや速さはニュートン力学で十分に予想ができますが、床で跳ねた後どの面を上にして止まるかはランダムで予測不能に思えます。
Shannon’s Information Theory
シャノンの情報理論
Claude Shannon defined the concept of information quantity based on how predictable an event is. If we know exactly what will happen next, the information gained is zero. When we cannot predict what will happen at all, the information obtained when the event happens is maximized.
クロード・シャノンは情報量という概念を、何かが起きた時にその事象がどれだけ予測できたかどうかを元に定義しました。次に何が起こるか完全にわかっている場合は得られる新しい情報はゼロ、何が起こるか全く予測できないとき、その事象が実際に起きたときに得られる情報量は最大になります。
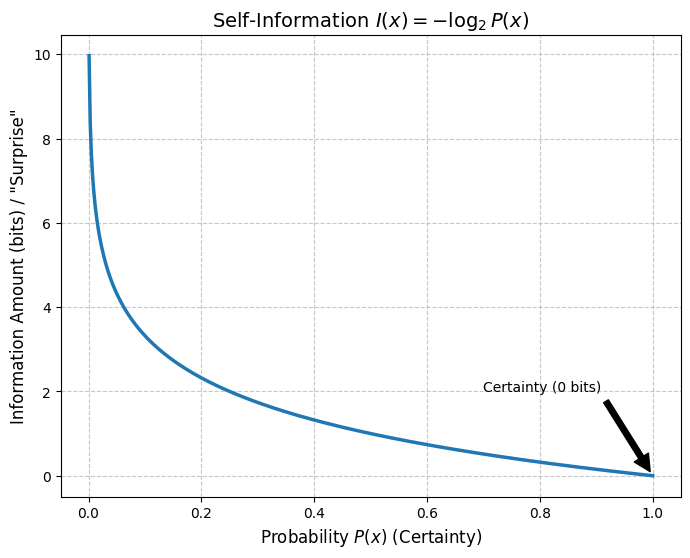
When the probability of an event occurring is , the self-information obtained from that event is defined as follows:
ある事象 が起こる確率を としたとき、その事象から得られる自己情報量 は次のように定義されます。
Plugging in actual values, if (certain), then , the information is zero. As becomes smaller, the value of increases—in other words, when something less likely happens, the amount of information gained becomes higher.
実際に値を入れてみると (確実)なら、、情報はゼロです。 が小さくなるほど、 の値は大きくなる、つまり可能性が低いことが起こると得られる情報量が高くなるというわけです。
The negative sign is there because ranges between 0 and 1, making negative. The logarithm base can be any number, but using 2 makes the unit of information bits—the number of binary digits needed to represent that information. For example, an event that occurs with a probability of 1/16 has an information content of , which corresponds to the fact that 4 bits are needed to represent 16 different cases.
マイナスがついているのは は0以上1以下なので がマイナスになるからです。対数の底はなんでも構わないのですが、2を選んだ場合の情報量の単位はビット、つまり2進数が何桁あればその情報を表すことができるかという表現になります。例えば1/16分の確率で起きる事象の情報量は となりますが、これは 16 通りのケースを表すのに4ビット必要になることと対応しています。
All graphs on this page were created in Python. All code can be viewed and executed in this Google Colab.
このページのグラフは全てPythonで作成しました。コードは全てこのGoogle Colab上で確認、実行できます。
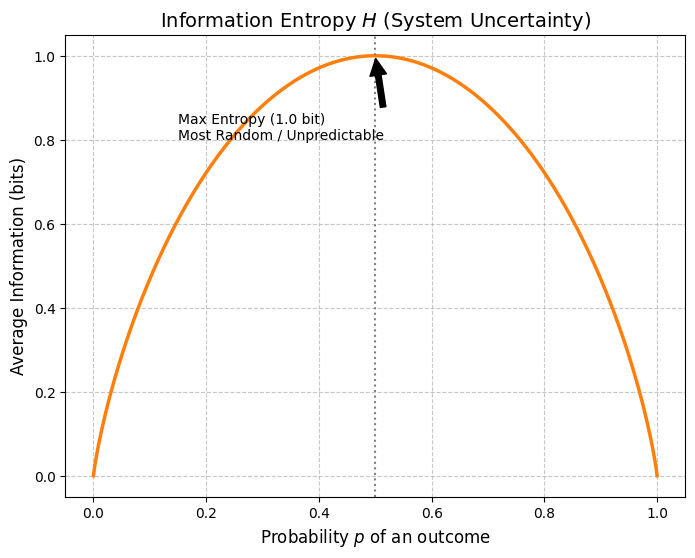
Building upon this, Shannon introduced information entropy as a measure of how unpredictable (random) the system as a whole is, which is the expected value of these information quantities.
さらに、システム全体としてどれくらい予測不能(ランダム)かを測る尺度として、シャノンはこれらの情報量の期待値である情報エントロピー を導入しました。
This entropy is maximized when all options occur with equal probability (), in other words, when the system is in “the most random state, where what will happen next is completely unpredictable.”
このエントロピー が最大になるのは、すべての選択肢が等確率()で起こるとき、つまり「次に何が起こるか全く予測がつかない、最もランダムな状態」のときです。
The graph below shows the entropy for a case with only two possible outcomes, such as a coin toss (). A biased coin designed for cheating behaves predictably, aligning with people’s expectations—yielding less information and lower entropy. Thinking this way makes it easier to understand intuitively.
下のグラフは、コイン投げのように二種類の結果しかない場合()のエントロピーを示しています。イカサマ用に確率を偏らせたコインは、人の予想に沿うように振る舞うため情報量が少なくなる、つまりエントロピーが低くなると考えれば、直感的に理解しやすいのではないでしょうか。
What’s interesting about this theory is that it defines how the quantity of information can be calculated without concretely defining what information itself is.
この理論の面白いところは情報とは何かを具体的に定義することなく、情報量という量がどう計算できるかを定義しているところです。
Chaos and Information
カオスと情報
The unpredictability in chaos arises from sensitive dependence on initial conditions. Small errors are amplified over time, and the outcome cannot be approximated by any method other than actually running the system. From the perspective of information theory, being random means that information is compressed and cannot be further reduced. In other words, chaotic systems appear random because their behavior constantly generates new, non-redundant information (things happen that could not have been known in advance).
カオスにおいて予測不能さが生まれるのは、初期値への敏感な依存性にあります。小さな誤差が時間の経過とともに増幅され、結果がその系を実際に動かす以外の方法で近似できない。情報理論の観点では、ランダムであるということは情報が凝縮されており、これ以上圧縮できない状態を指します。カオス系がランダムに見えるのは、その挙動が常に新しい、冗長性のない情報を生成し続けている(事前に知り得なかったことが起きる)からだと言い換えることができます。
However, just as fractal patterns can be observed in the logistic map, chaos sometimes shows certain patterns. In fact, systems that are unpredictable yet show some kind of pattern are more intriguing and make for more interesting research and sketching subjects than systems that become completely random.
ただ、ロジスティック写像にフラクタルなパターンが見て取れるように、カオスにはある種のパターンが見られることがあります。というより、完全にランダムになってしまう系よりも予測不能でありながらある種のパターンが見て取れる系の方が興味をそそるし、研究やスケッチの題材として面白いという側面もあるでしょう。
The graph below shows the information entropy calculated for Logistic Mapping.
下のグラフはロジスティック写像の情報エントロピーを計算したものです。
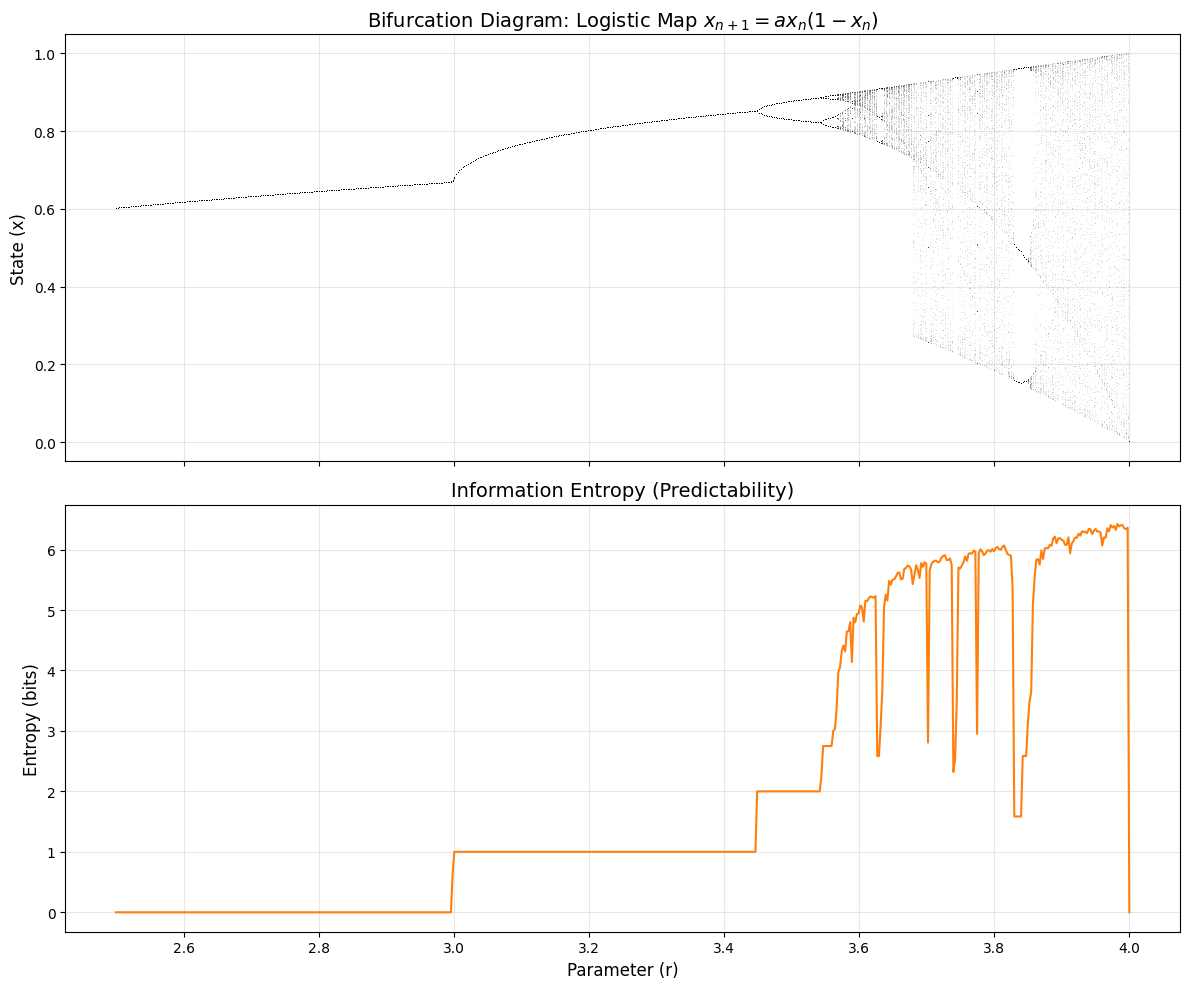
First, for a specific , we obtain the behavior (trajectory) after sufficient time has passed as time-series data points.
まず、特定の において、十分に時間が経過した後の挙動(軌道)を 個の時系列データとして取得します。
Let the resulting dataset be .
ここで得られるデータセットを とします。
The output of the logistic map takes continuous values between and , but to calculate information entropy, we need to treat this as discrete probabilities. Therefore, we divide the state space into small bins, and find the probability that data falls into each bin .
ロジスティック写像の出力 は から の間の連続値をとりますが、情報エントロピーを計算するには、これを離散的な確率として扱う必要があります。そこで、状態空間 を 個の小さな箱(ビン)に分割し、各箱 にデータが落ちる確率 を求めます。
We apply the definition of information entropy to the obtained probability distribution. This becomes the value on the vertical axis of the graph.
得られた確率分布に対して、情報エントロピーの定義を適用します。これがグラフの縦軸の値になります。
Looking at the graph, in the region where , the behavior converges to a single value, which means what will happen is 100% predictable. So entropy becomes 0.
グラフをみると の領域では挙動が1つの値に収束、つまり何が起きるか100%予測できるため、エントロピーは0になります。
In the range , the values bifurcate into 2, 4, 8… Since the options are limited, entropy increases slightly but remains at a low value.
の間では値が2, 4, 8… と枝分かれしていきます。選択肢が限られているため、エントロピーはわずかに上昇しますが、まだ低い値です。
At , entropy jumps up sharply. This means the system has become extremely difficult to predict. Within this region, there are places where entropy suddenly drops (for example: ). These are the locations where certain patterns emerge within the logistic map. This quality—neither too simple nor completely random like white noise—could be said to be one reason why chaos is worth appreciating and considering.
ではエントロピーが急激に跳ね上がります。これは系が非常に予測困難になったことを意味します。その中でも突然エントロピーがガクンと下がる場所があります(例: )。ここがロジスティック写像の中である種のパターンを生み出している場所です。単純過ぎず、しかしホワイトノイズのような完全なランダムではない性質が、カオスが鑑賞や考慮に値するひとつの理由だとも言えるでしょう。
KS Entropy
KSエントロピー
The entropy we calculated so far measured the complexity of the static distribution, i.e., where in the state space the trajectory stays and how frequently it visits each location for a given parameter . In other words, it’s like looking at how much complex structure (pattern) is recorded in a single long-exposure photograph.
ここまでの計算で求めたエントロピー は、あるパラメータ において軌道がどの場所に、どのくらいの頻度で滞在するかという静的な分布の複雑さを測ったものでした。いわば、長時間露光で撮った1枚の写真の中に、どれだけ複雑な模様(構造)が記録されているかを見ていると言えます。
To understand the dynamics of chaos, there is another important concept: KS entropy (Kolmogorov-Sinai entropy).
カオスのダイナミクスを理解するにはもう1つ、KSエントロピー(コルモゴロフ・シナイ・エントロピー)という重要な概念があります。
KS entropy defines the rate of information generation—how much new information emerges with each step forward. This concept is closely related to the Lyapunov exponent, which we’ll discuss later in detail, but intuitively, think of it this way:
KSエントロピーは、1ステップ進むごとに、どれだけ新しい情報が湧き出しているかという情報の生成速度を定義します。この概念は後で触れるリアプノフ指数と密接に関連しているので詳細はそこでまた触れますが、直感的には下のように考えてみてください。
-
Divide the state space where the chaotic trajectory exists into small grids (bins).
-
Record which bins the trajectory passes through. If you name the bins, you can represent this as a sequence of letters: bin A, bin B, bin C, and so on.
-
When the trajectory has progressed A → B → C, predict which bin it will enter next. In an orderly system where the next state is 100% predictable, the information gain is 0 bits. In a chaotic system where the next state is unpredictable, information is being generated. For example, if it can branch into any of 16 bins with equal probability, then 4 bits of information are being generated per step.
-
カオスの軌道が存在する空間を、小さなグリッド(箱)に分割する。
-
軌道がどの箱を通ったかを記録します。箱に名前をつけると、Aの箱、Bの箱、Cの箱……という文字の並びとして表現できる。
-
A → B → Cと進んできたとき、次にどの箱に入るかを予測する。秩序的な系で次が100%予測できるなら、情報の増加は0ビット。カオスな系で次が予測できないならそこで情報が生まれている。例えば16通りの箱のどれかに同じ確率で分岐するならステップごとに4ビットの情報が生成されている。
この1ステップあたりに生成される情報の平均量の極限をとったものがKSエントロピーです。
KS entropy is the limit of the average amount of information generated per step.
Stretch and Fold
引き伸ばしと折り畳み
次のページではカオスを生み出す原動力とも言える引き伸ばしと折り畳みの概念について見ていきます。