Projection プロジェクション
From ancient cave drawings to paintings, cartography, cinema, and more recently, computer graphics, people have sought to depict the world around them on two-dimensional surfaces. Projection is a fundamental concept and method used in these endeavors, involving the transformation of 3D objects into 2D representations.
古代の洞窟の壁画から絵画、地図の作成、映画、そして最近ではコンピュータグラフィックスまで、人々は2次元の表面に周りの世界を描こうとしてきました。プロジェクション(投影)はこれらの分野で3次元の物体を2次元の表現に変換するために用いられる基本的な概念と手法です。
In mathematics, projection is the process of mapping points from one space to another, not necessarily from 3D to 2D.
数学では、projectionは3次元から2次元に限らず、1つの空間から別の空間へと点を写像するプロセスを指します。この場合、「射影」という訳語が使われます。
Perspective Projection 透視投影
In 3D graphics, two primary types of projections are frequently used: perspective projection and parallel projection.
3Dグラフィックスでは、主に2つのタイプの投影が使われます。透視投影と平行投影です。
Perspective projection is a type of projection that creates an illusion of depth and perspective by making objects appear smaller as they move further from the viewer. To understand this, you can imagine drawing two lines of sight from the viewer to the opposite edges of an object. The angle between these lines becomes wider when the object is closer to the eye, and narrower when it moves away. This is basically the reason why an object appears larger or smaller depending on its distance.
透視投影は、物体が視点から遠ざかるにつれて小さく見えるようにして、遠近感を生み出す投影の一種です。理解のために、視点から物体の両端に向かって描かれた2本の線を想像してください。この2本の線の間の角度は、物体が目に近づくほど広がり、遠ざかるほど狭まります。これが、距離によって物体が大きく見えたり小さく見えたりする理由です。
One way to illustrate perspective projection is to visualize a screen positioned between the viewer (like an eyeball or camera) and the objects to be depicted. When you draw a line from the viewpoint to a point on an object, the line will intersect the screen at a single point. This is where the point on the object is “projected” onto the screen.
透視投影を説明する方法の1つは、(目やカメラのような)視点と描かれる対象の間にスクリーンが置かれた様子を描くことです。視点から物体上の点へ線を引くと、その線はスクリーンと1点で交わります。これが、物体上の点がスクリーン上に「投影される」場所です。
To express this mathematically, we can say that a point in 3D space is projected onto a point on the 2D screen as:
数式で表すと、3D 空間内の点 は、下記のように2Dスクリーン上の点に投影されます。
Here, is the focal length or the distance from the viewpoint to the screen along the viewing axis. Meanwhile, represents the distance from the viewer’s location (or camera center) to the object along the same axis. Because we are projecting onto a 2D plane, the component has disappeared, but the distance is reflected as the multiplier for and ().
ここでは、は視点から視線の軸に沿ったスクリーンまでの距離で、焦点距離とも呼ばれます。一方、は同軸上における視点(またはカメラの中心)から物体までの距離です。2D平面に投影しているので、成分は消えてしまいましたが、距離はとに対して掛ける数に反映されています()。
The demo below illustrates this concept from a side view, with the z-axis running from left to right and the x-axis from top to bottom.
デモは、このコンセプトを横から見た図で示しています。水平方向がz軸、垂直方向がx軸です。
When we talk about focal length, we also need to know the size of the screen, film, or camera sensor. With these two parameters, we can measure how much of the view the object will occupy.
焦点距離を考える際には、スクリーン、またはカメラのフィルムかセンサーのサイズも把握する必要があります。これら2つのパラメータがあれば、被写体が視界のどれだけの範囲を占めるかを測れます。
Parallel Projection 平行投影
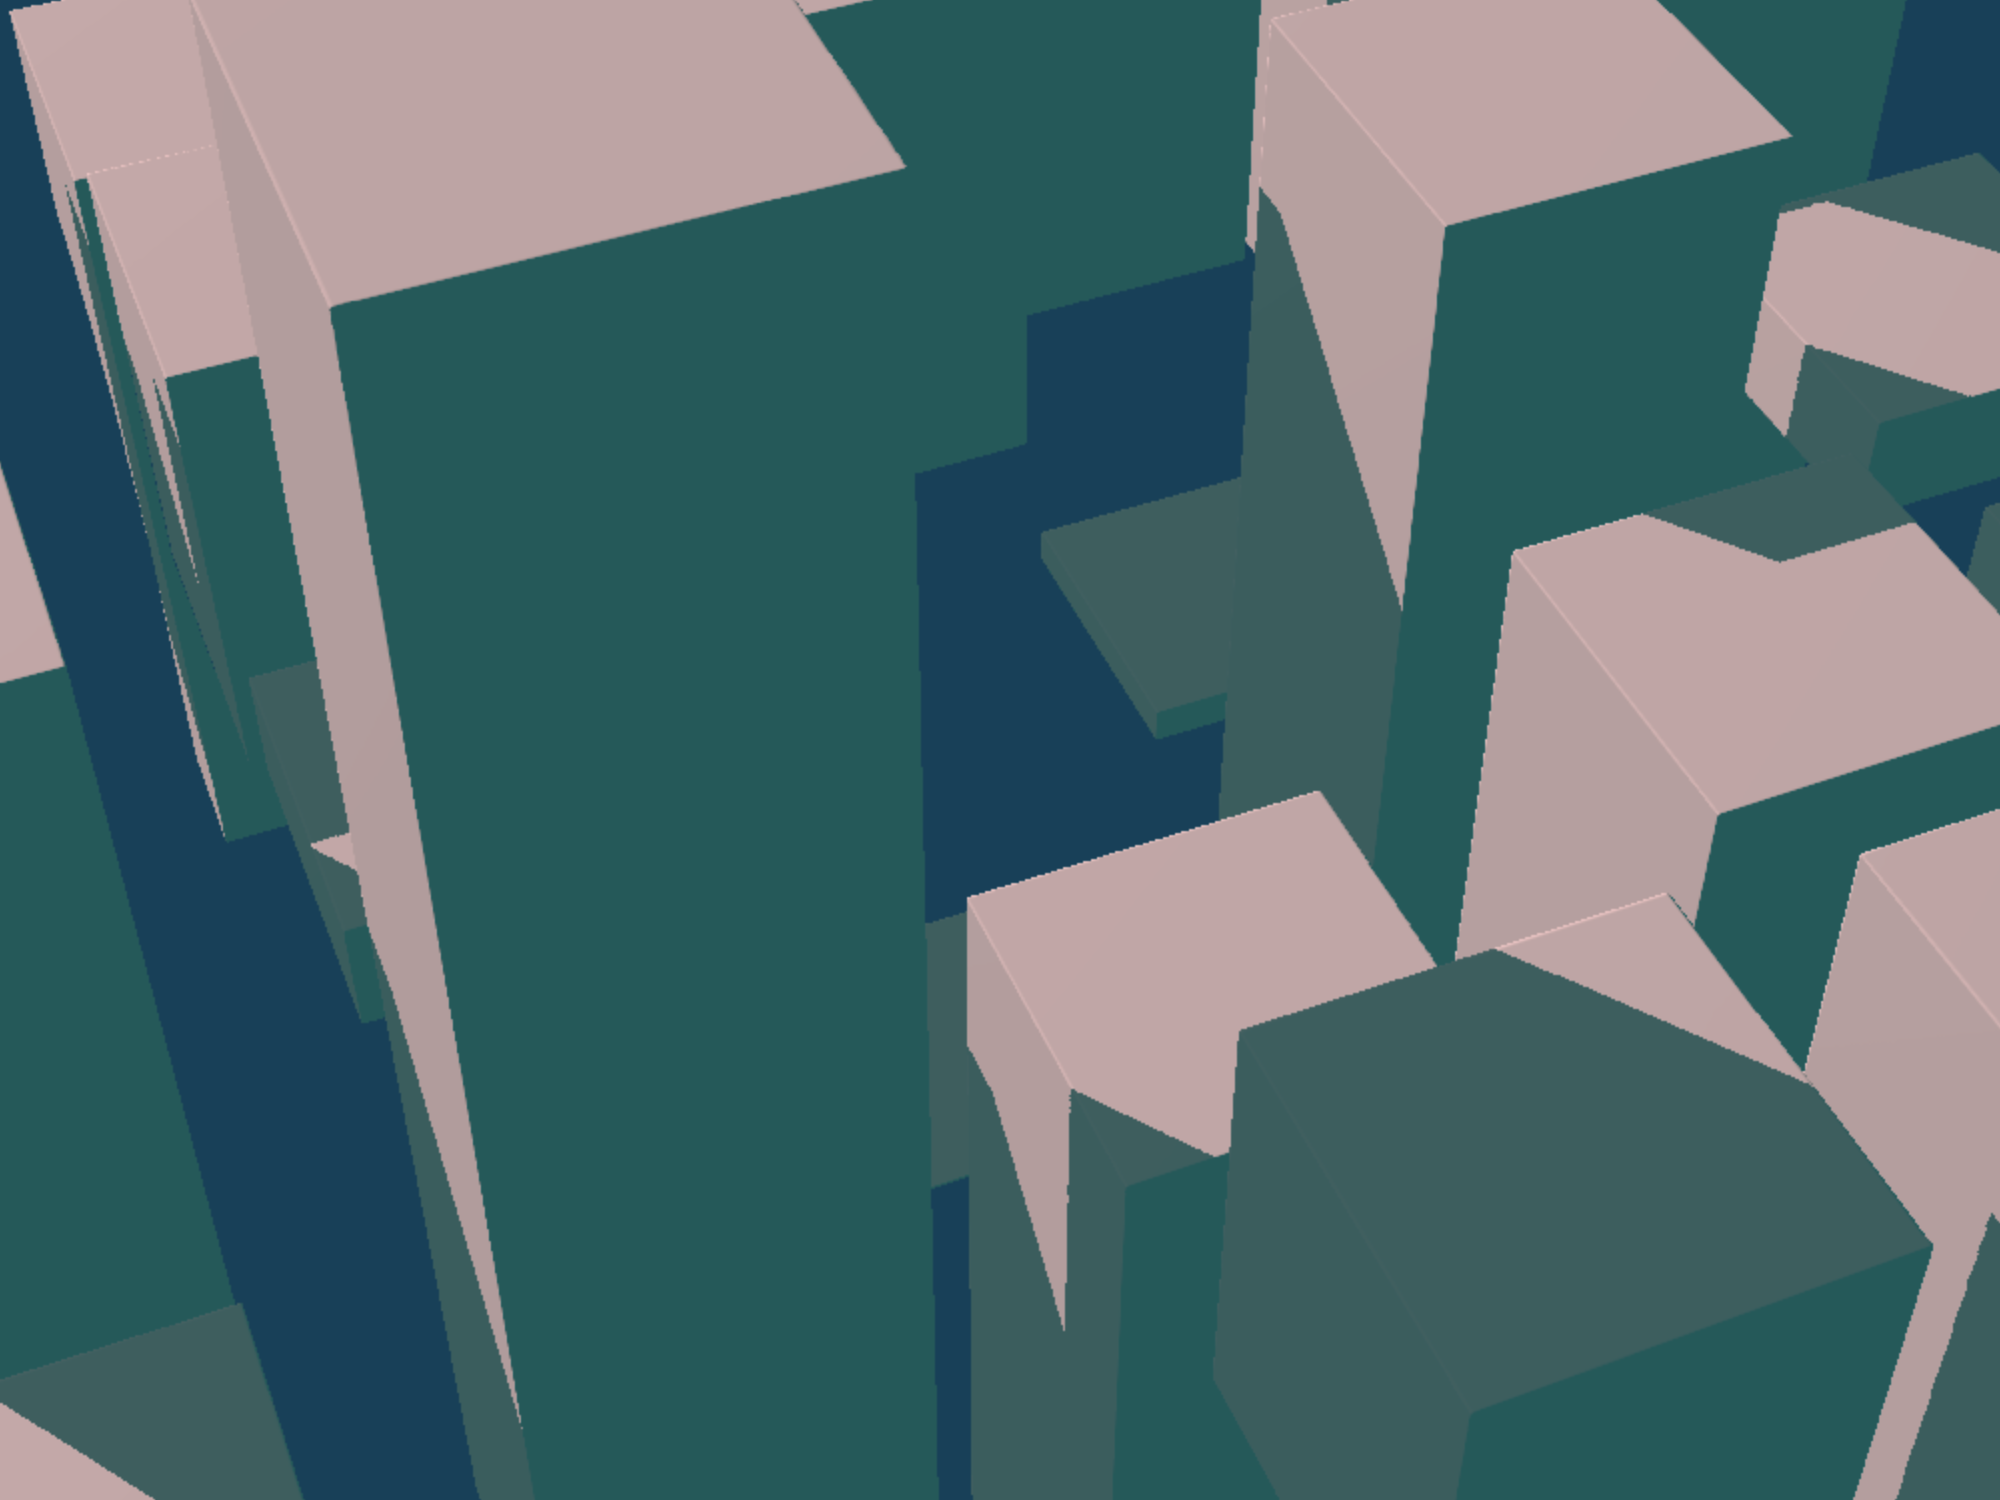
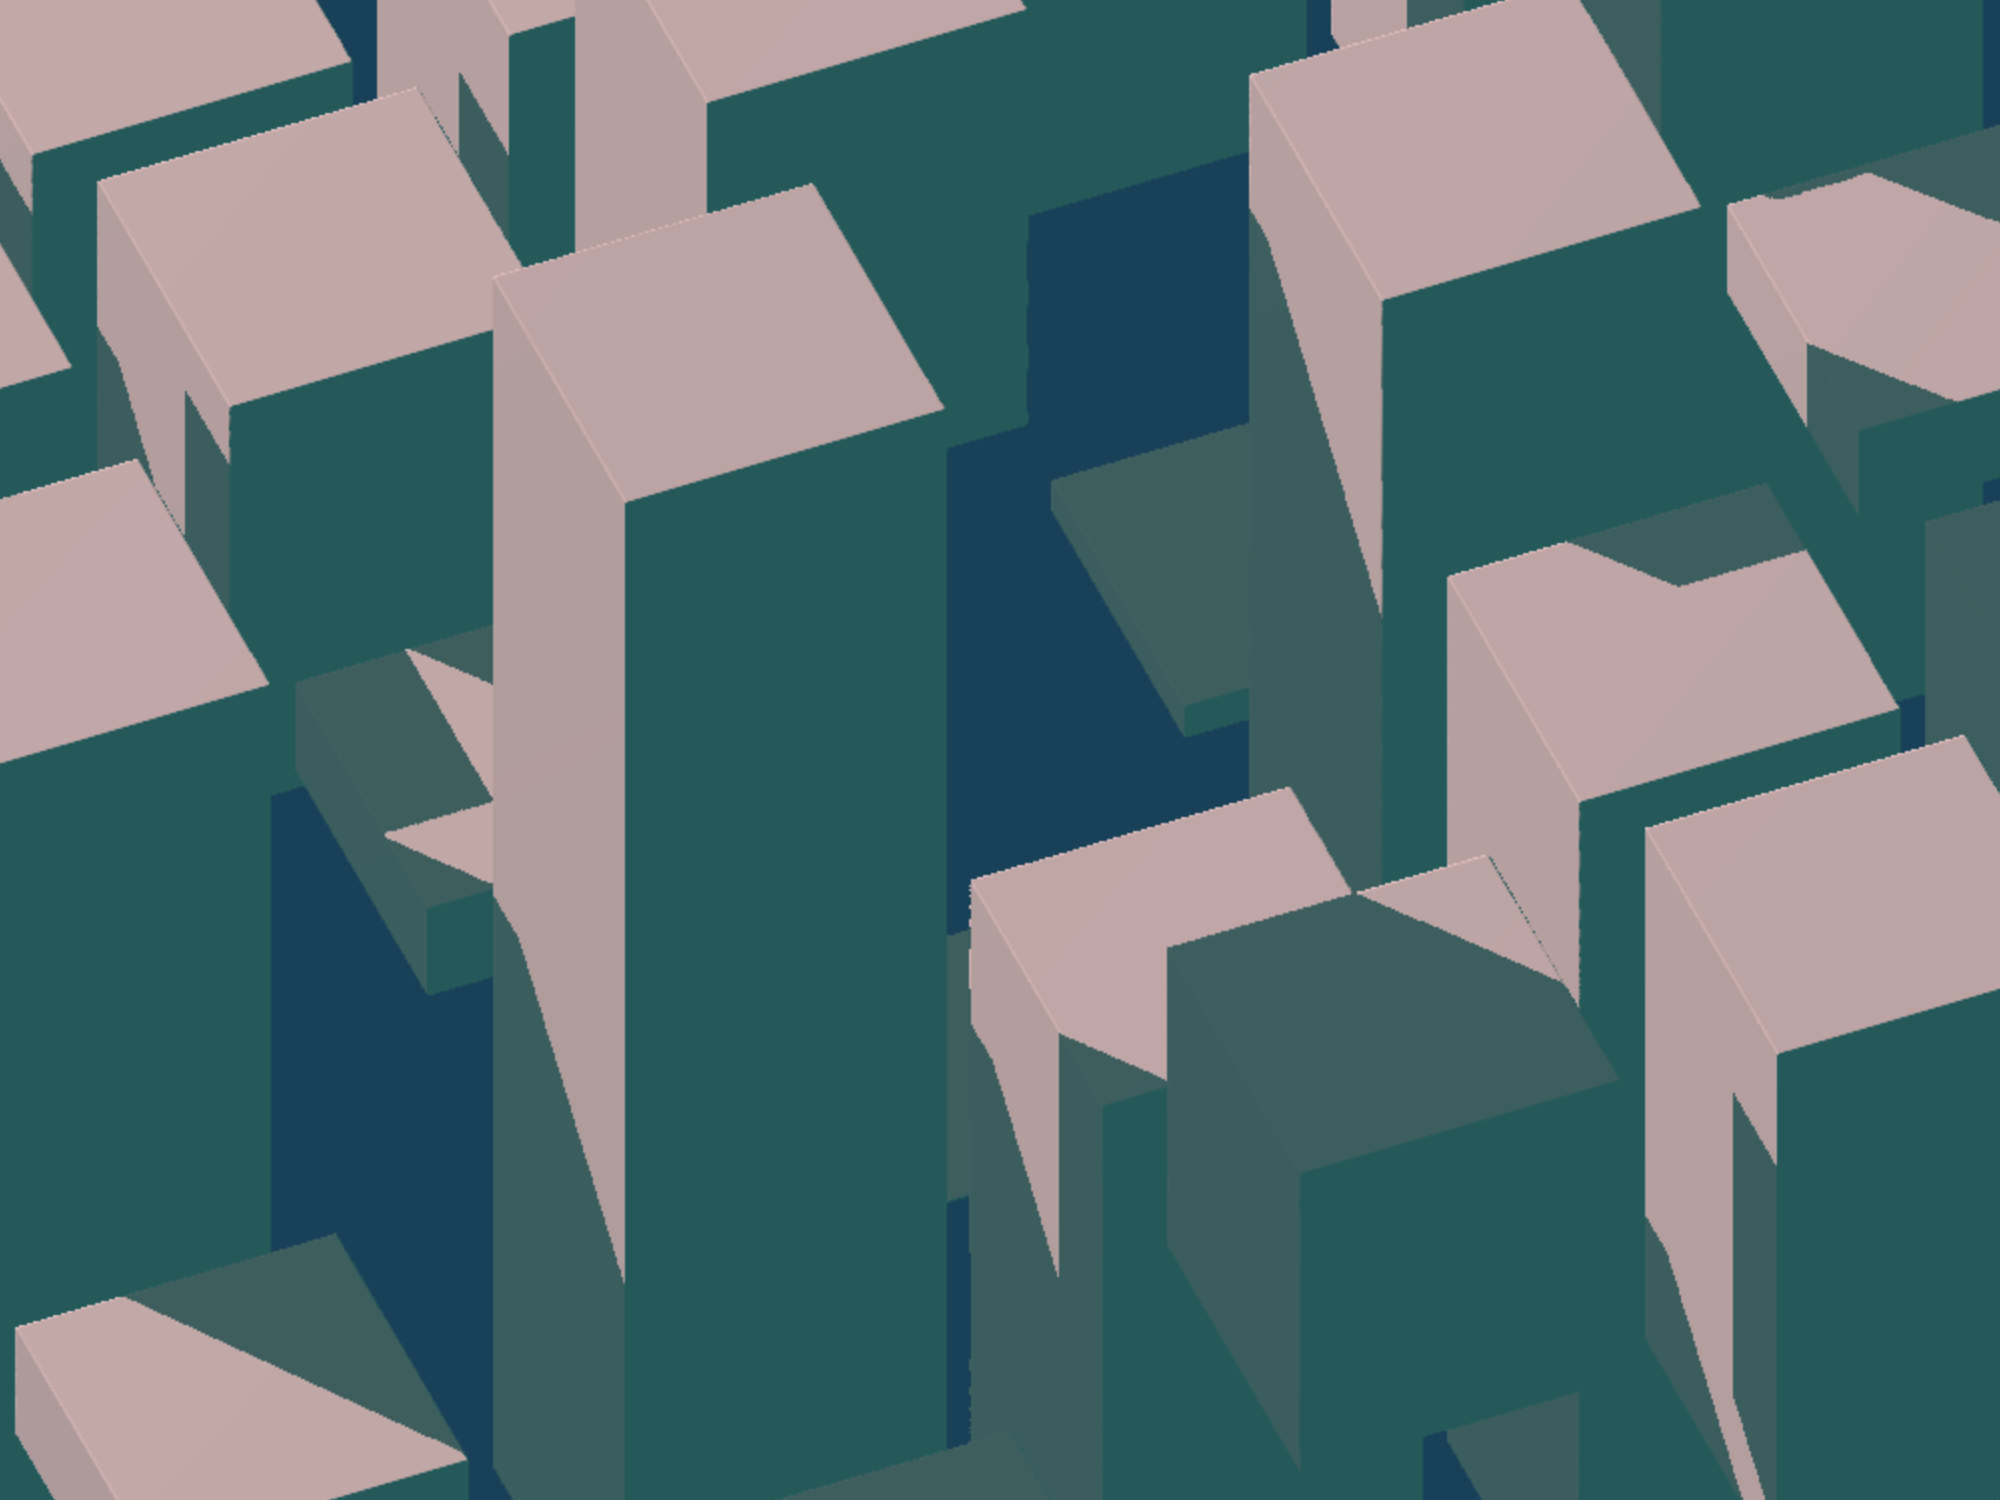
In parallel projection, all projection lines are parallel to each other. This means that objects maintain their relative size, regardless of their depth. Parallel projection is commonly used in engineering and architectural drawings to accurately depict the size relationship between objects. For example, building instructions for LEGO bricks are in parallel projection to keep the size of the bricks in the illustrations consistent.
平行投影では、すべての投影線が互いに平行なので、物体の大きさが奥行きに関係なく相対的な大きさを保持します。平行投影は、エンジニアリングや建築の図面で、物体の大きさの関係を正確に描くためによく用いられます。例えば、LEGOブロックの説明書では、イラスト上のブロックの大きさを一定にするために平行投影が使われています。
To create a picture with parallel projection, we can also imagine a screen positioned in front of the objects. But instead of drawing lines towards a single viewpoint, we draw parallel lines that are perpendicular to the screen.
平行投影で画像を作る場合にも対象の前に置かれたスクリーンを考えますが、単一の視点に向かって線を引く代わりにスクリーンに垂直な平行線を引きます。
If the screen is perpendicular to the z-axis, a point will be simply projected onto on the 2D screen.
スクリーンがz軸に垂直な場合、点 は単純に2Dスクリーン上の に投影されます。
Map Projections 地図投影法
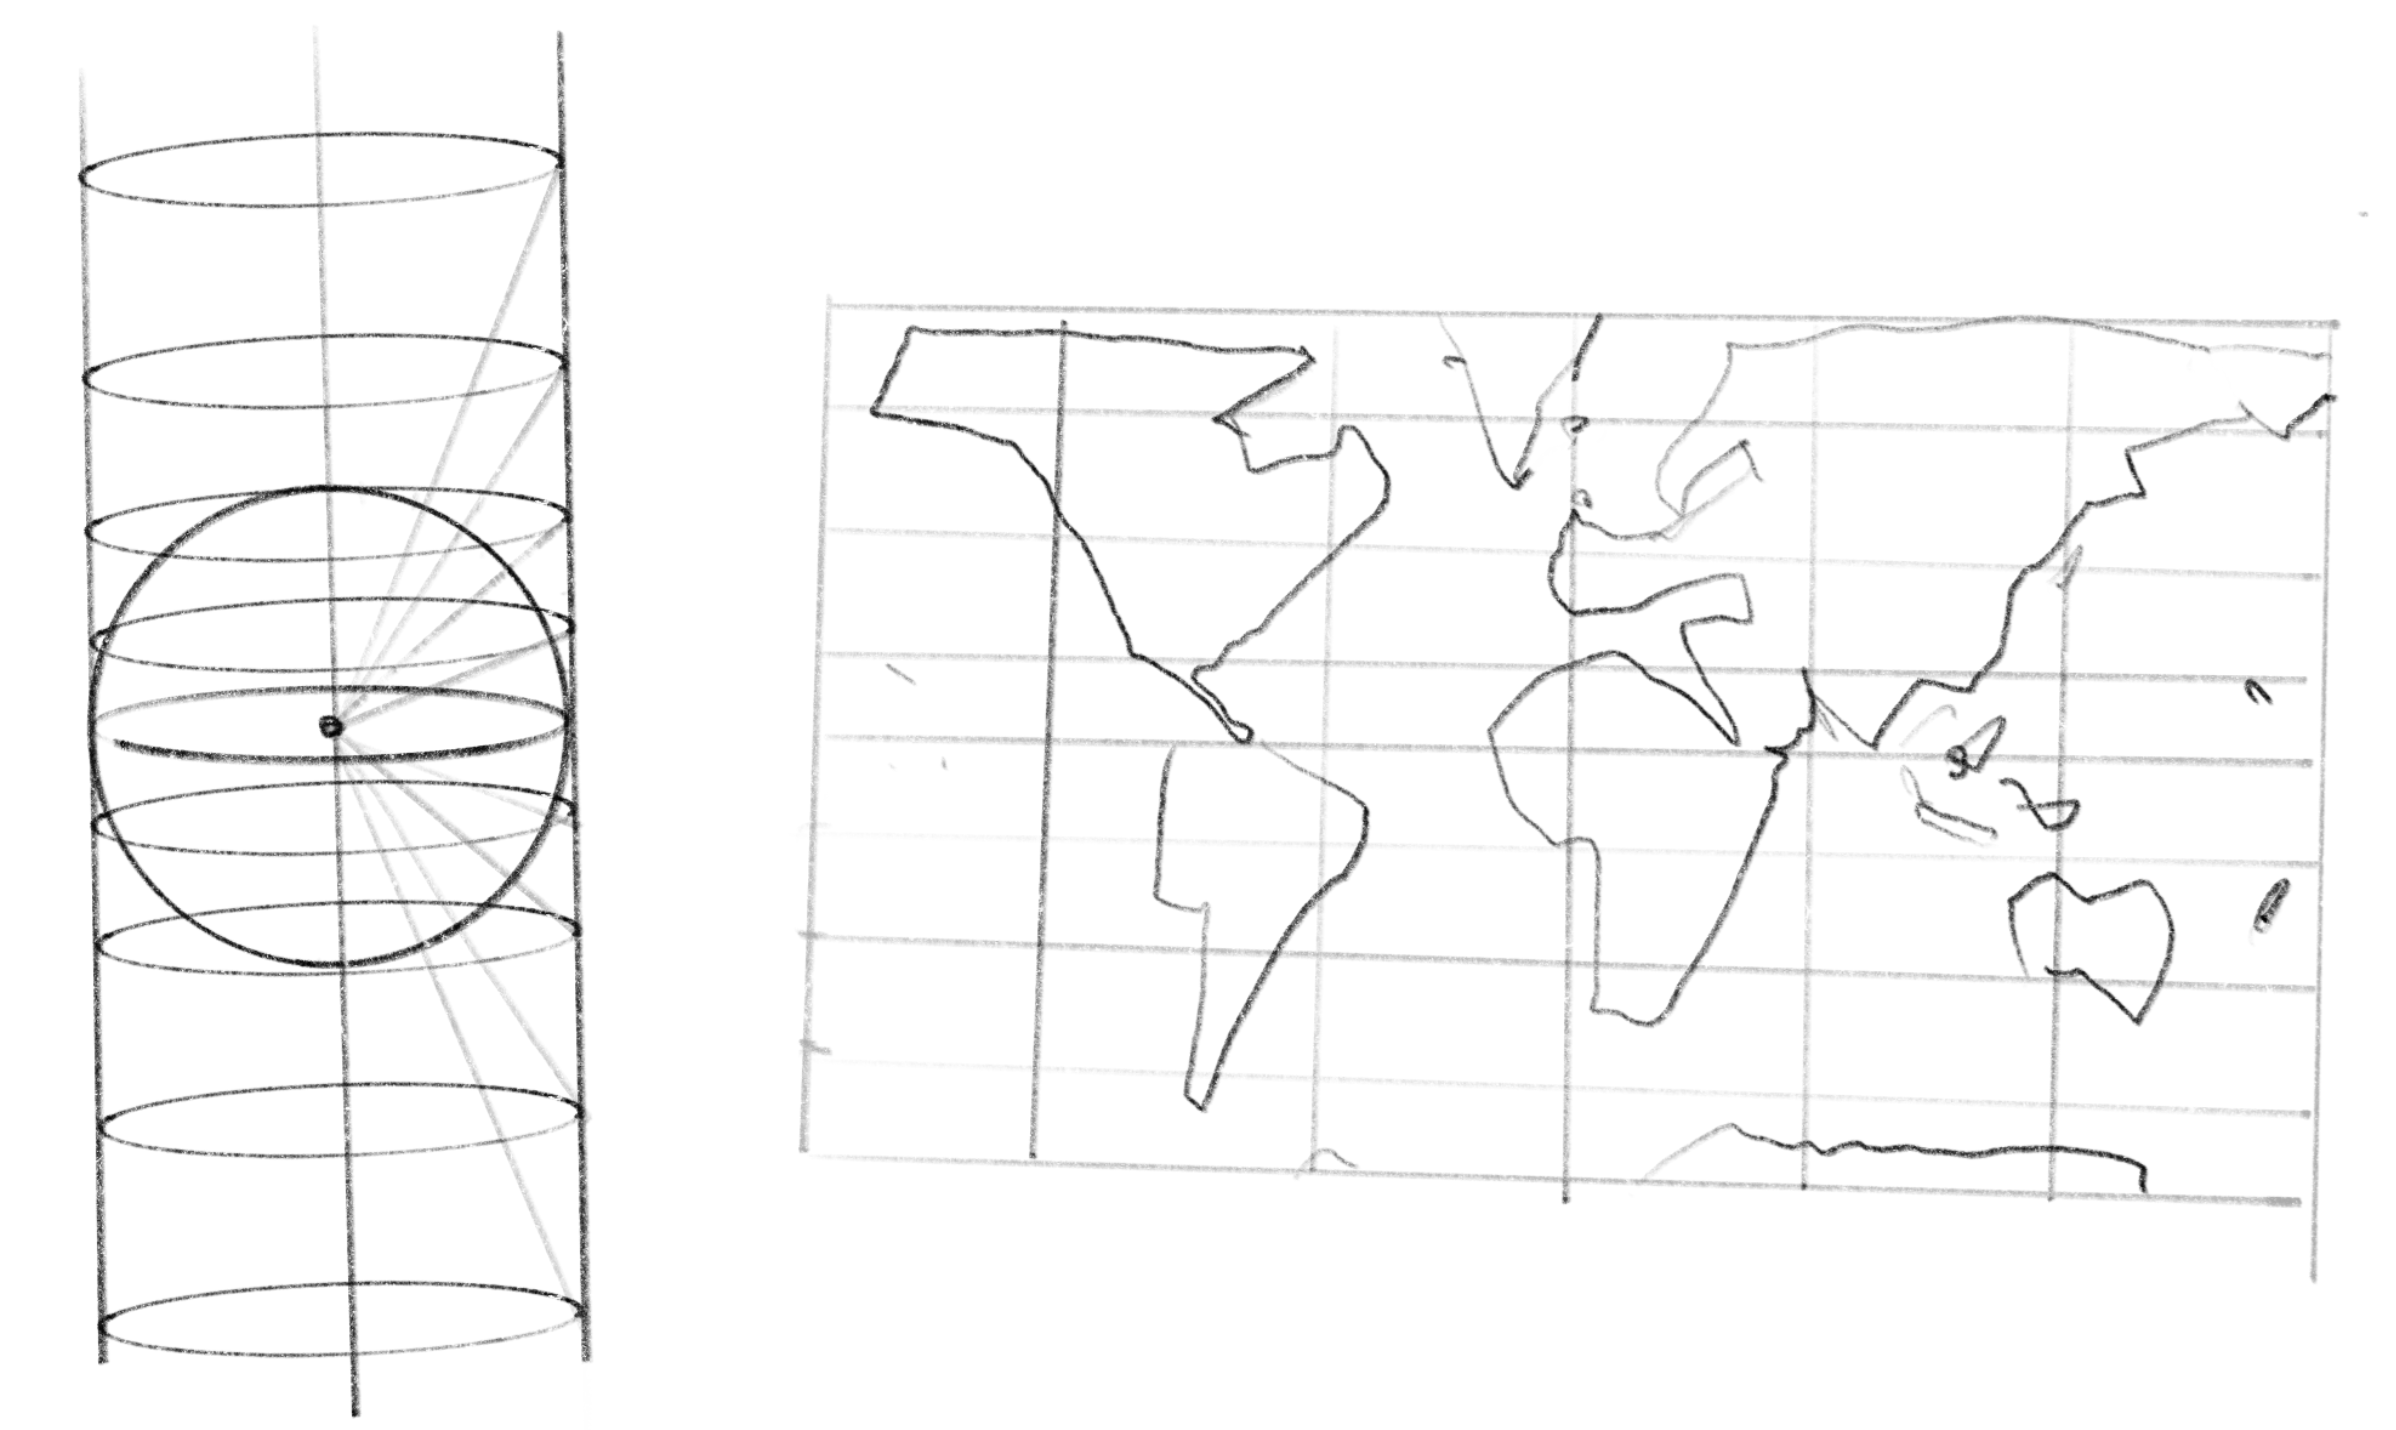
Maps are a classic example of projections. While maps of small regions can be easily approximated as a flat plane, representing the entire Earth on a plane is not straightforward. Numerous projection techniques have been invented for different purposes, since there is no perfect solution. These methods are called cartographic projections.
地図は古典的な投影の例です。小さな地域の地図は簡単に平面で近似できますが、地球全体を平面上に表現するのは容易ではありません。完璧な解決策はないため、さまざまな目的のために多くの投影手法が考案されてきました。これらの手法は地図投影法と呼ばれます。
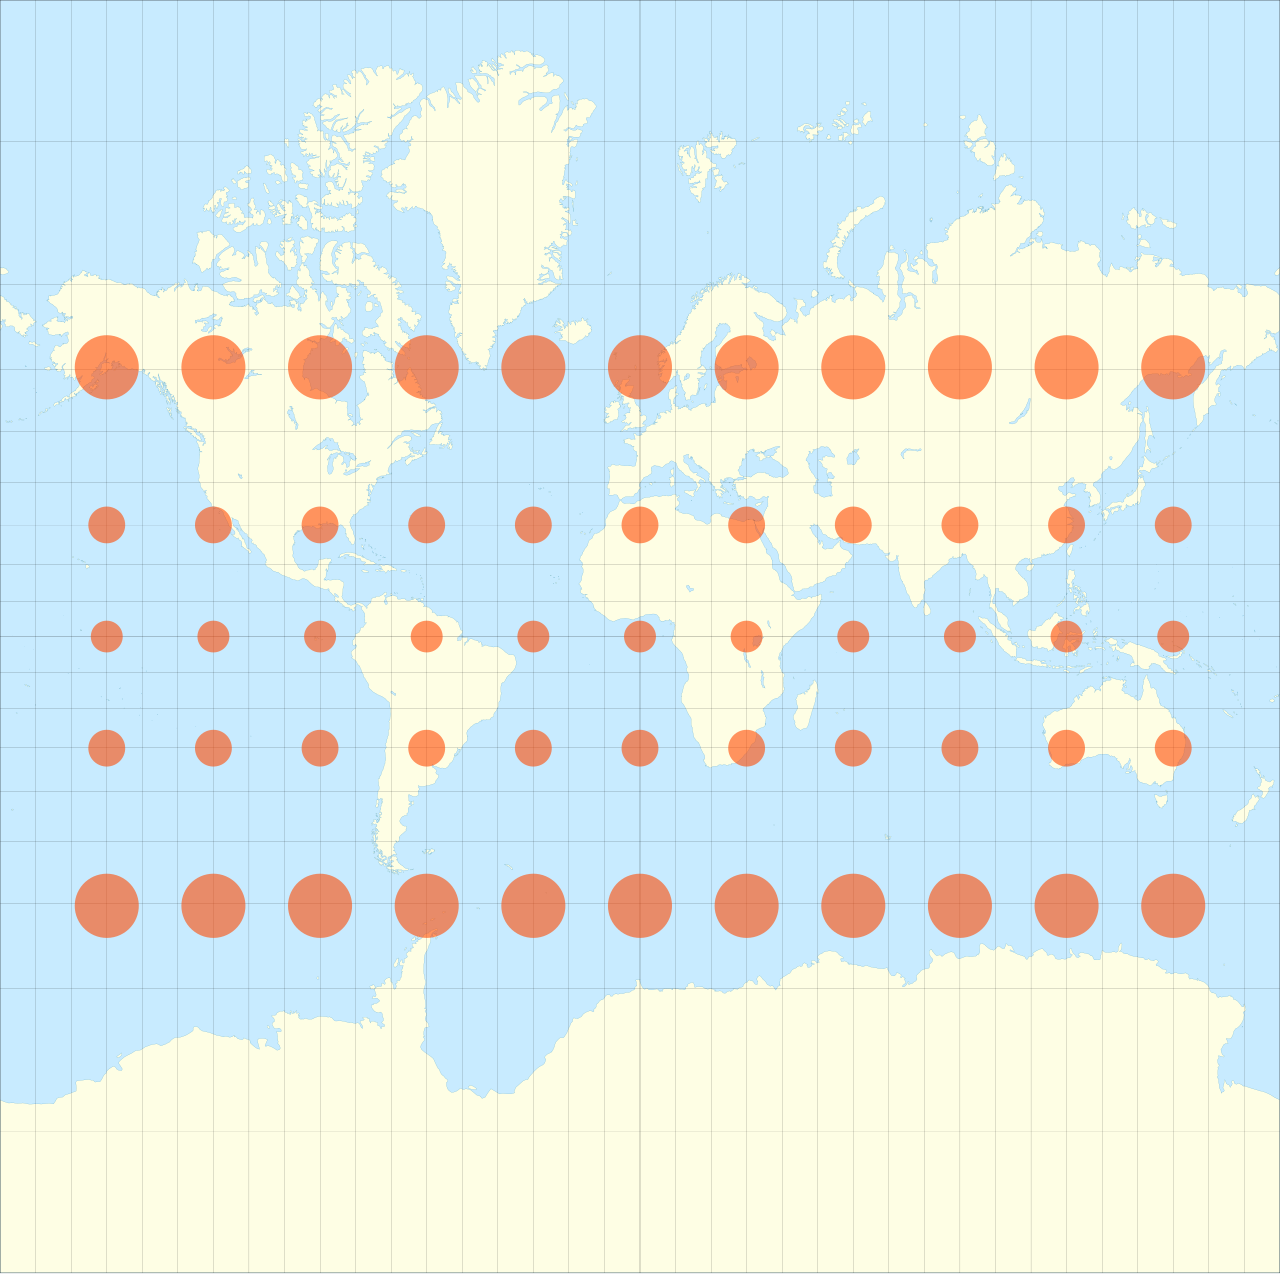
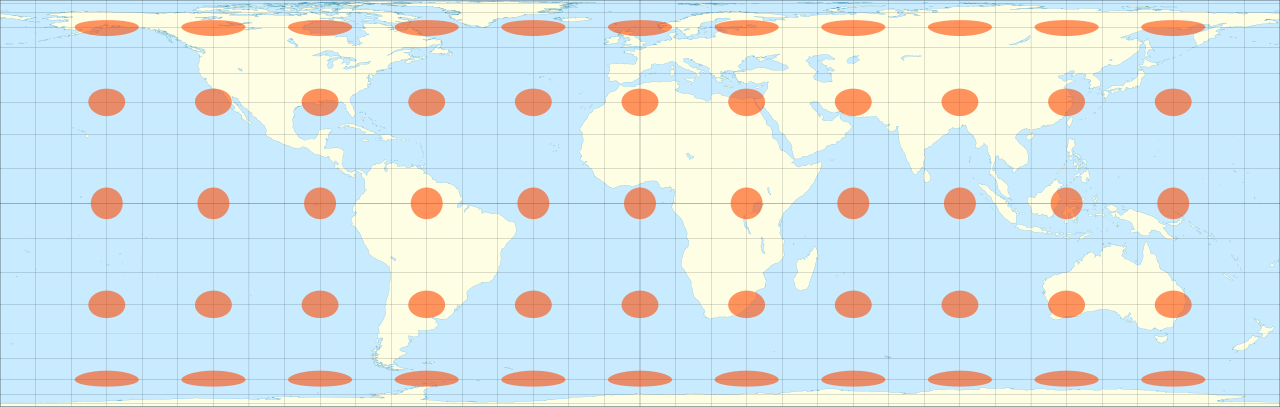
For example, the Mercator projection is great for navigation because it preserves angles, but it exaggerates sizes near the poles. Conversely, the Lambert Cylindrical Equal-Area projection maintains true area sizes, but can distort shapes, especially near the poles. Each has its own strengths and weaknesses depending on the context.
たとえばメルカトル図法は角度を保持するため、航海には適していますが、極近くのサイズを誇張してしまいます。逆にランベルト円筒等積投影は正しい面積を維持しますが、特に極近くでは形が歪んでしまいます。それぞれの手法には、使い道に応じた長所と短所があります。
The circles on the two maps below are called Tissot’s Indicatrix, which show how circles of the same size are distorted on the map.
下の2つの地図に描かれた丸はティソーの指示楕円と呼ばれ、同じ大きさの円が地図上でどのように歪むかを示すものです。
The Mercator projection mathematically transforms the Earth’s spherical coordinates, specifically the latitude () and longitude () into planar coordinates (, ) .
メルカトル図法は、数学的に地球の球面座標、具体的には緯度()と経度()を平面座標(、)に変換します。
For various map projections, refer to the map projections on Wikipedia.
様々な地図投影法については、Wikipediaの投影法 (地図)を参照してください。
For those familiar with 3D computer graphics, the concept of texture “mapping” might be familiar territory. Texture mapping essentially operates in the reverse of the 3D to 2D projection. It’s about taking a 2D image and wrapping it around a 3D model, which is also a projection. For instance, the inverse of the Mercator projection can be used to map 2D textures onto a globe.
3Dグラフィックスに詳しい人は、テクスチャ「マッピング」という概念を知っているでしょう。テクスチャマッピングは基本的に、3Dから2Dへの投影の逆の操作、2D画像を3Dモデルに巻き付けるというもので、それ自体も一種の投影です。たとえば、メルカトル投影の逆を使用して、2Dテクスチャを地球儀にマッピングすることができます。
Other Perspectives その他の投影
Keep in mind that the ways you represent 3D scenes on a 2D surface don’t have to be limited to math and straight lines. When we draw maps by hand, we capture the essence of the path, sometimes disregarding precise angles and distances, and instead focusing on the relationships between landmarks. Children’s drawings don’t bother with all the details of depth and perspective and thus provide fresh perspectives. Cubists incorporate different views of an object into a single flat canvas. Traditional Japanese paintings visualize scenes from a bird’s-eye view, disregarding perspective to create flattened yet intricate representations. All these are great examples of projecting the world onto a plane. We can freely select or invent a method that works best to convey what we want.
3Dのシーンを2Dの表面で表現する方法は、数学や直線に限定される必要はありません。手で地図を描くときには、正確な角度や距離を無視してランドマーク間の関係に注目することで、その経路の大事な点を表現できます。子供の絵は、細かな遠近にこだわることなく、新鮮な視点を提供します。キュビストは、1枚の平らなキャンバスに異なる視点から見た対象の姿を統合します。そして、伝統的な日本の絵画は遠近を無視した鳥瞰図を用いて平坦かつ複雑な表現を作り出します。これらはすべて、世界を平面に射影する素晴らしい例です。私たちは、伝えたい内容に最適な方法を選んだり、発明することができます。