Dimensions 次元
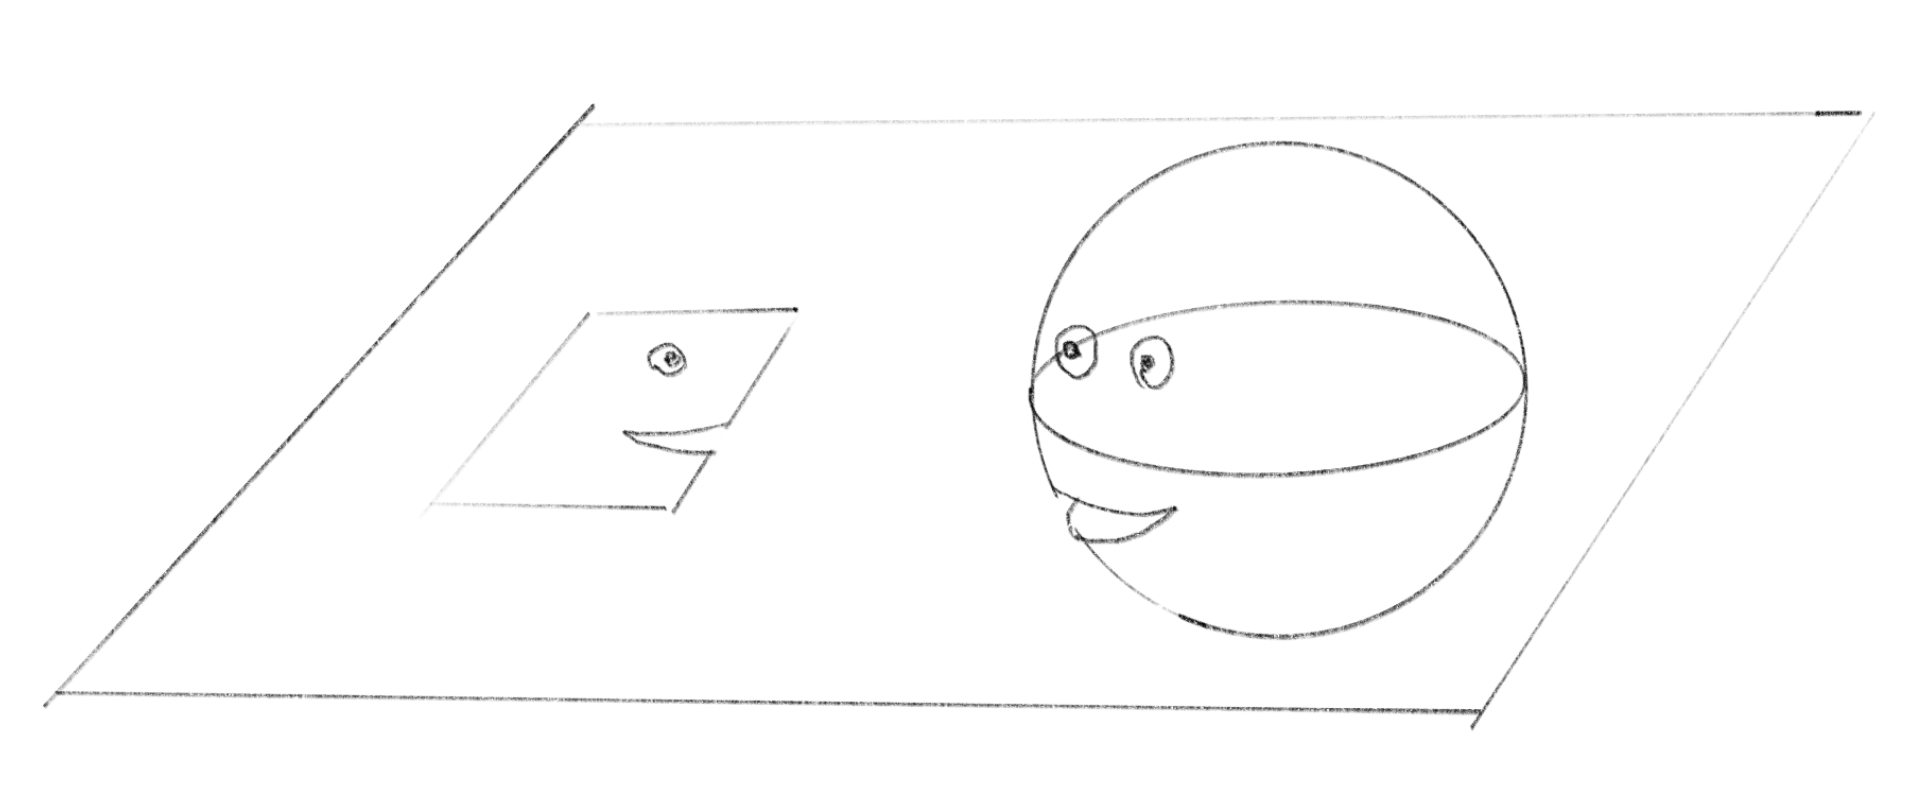
In 1884, Edwin A. Abbott wrote a peculiar novel about people living in Flatland, a two-dimensional world. The main character, the Square, dreams about Lineland—a one-dimensional world—and eventually meets the Sphere, who takes him to Spaceland, a three-dimensional world.
1884年、エドウィン・A・アボットは、2次元世界のフラットランドに住む人々についての奇妙な小説を書きました。主人公のスクエア(正方形)は、1次元世界のラインランドの夢を見たり、スフィア(球体)に出会って3次元世界のスペースランドへと連れて行かれたりします。
For the Square, the three-dimensional world was totally unimaginable until he actually saw it. But his ability to understand it might suggest that he was already part of a three-dimensional world without realizing it. Then what about the world we live in? Is this world three-dimensional, or are there invisible dimensions that we just haven’t noticed? Luckily, we have ways to deal with higher dimensions even when we can’t see them. With some math, we can express things in dimensions higher than three, perform operations, and use them for practical stuff or just for fun.
3次元の世界はスクエアにとって、実際に見るまで全く想像できないものでした。しかし、見たら理解できたということは、気づかなかっただけですでに3次元の世界にいたということかもしれません。では我々が住むこの世界はどうでしょう。この世界は3次元でしょうか。それとも見えない次元が存在しているのに気がついていないだけでしょうか。幸い、我々には高次元を見ることができなくても、それを扱う方法があります。ちょっとした数学を使えば、3次元以上の次元のものを表現し、演算を行ったり、実用的なことに使ったり、ただ面白がったりできます。
Dimensionality is a crucial concept in understanding how we see and picture the world, not limited to the physical world but various kinds of data. On this page, we will journey through the simplest 1D world to higher dimensions.
次元の概念は、人が世界をどのように認識し理解するかを把握する上でとても重要です。この概念は物理的な世界だけでなく、様々な種類のデータにも適用されます。このページでは、最も単純な1次元の世界から高次元まで、順に巡っていくことにしましょう。
1D
1次元
Imagine if the world was just a line. An object in this world is a line segment, which has only length, with no width or height. The movement is restricted to forward or backward along this line (whichever direction is considered “front”).
一本の線だけで構成される世界を想像してみましょう。この世界の物体は長さのみを持ち、幅も高さもない線分です。動きは、この線に沿って前後(どちらを前とするかによりますが)だけに限定されています。
To annotate the position and size of an object, we need an origin. Let’s assume there is a point on this line and we call it the origin. This is just an arbitrary point, but we need to fix this point in order to measure things. We might also want a unit of length, but for now we can think abstractly and say “1” is the unit length.
物体の位置や大きさを記述するには、原点が必要です。この線上のある点を原点と呼ぶことにしましょう。どこに置いても良いのですが、物事を測定するためにはこの点を固定する必要があります。長さの単位も必要かもしれませんが、とりあえず抽象的に考えて、「1」を単位の長さとしましょう。
The position in this world can be described by a single value. And the length is the distance between the two ends of the line segment.
この世界での位置は数値ひとつで表すことができます。そして長さは、線分の両端の間の距離となります。
2D
2次元
A 2D world is a plane where a position can be described by two values. Imagine two perpendicular lines—let’s call them axes—with their crossing point as the origin. The first number indicates how far a point is from the origin along the first axis, while the second number represents its distance along the second axis. We often call them x-axis and y-axis, but the names can be anything. The important point is that they are perpendicular, or independent, meaning moving along one axis doesn’t change the position along the other axis.
2次元世界は平面で、位置を2つの数値で表せます。互いに垂直に交わる2本の線を想像してみましょう。これらを軸と呼び、その交点を原点とします。1つ目の値は、第一軸に沿った点の原点からの距離を示し、2つ目の値は第二軸に沿った距離を表します。これらの軸はよくx軸とy軸と呼ばれますが、名称はなんでも構いません。大事なのは、軸が垂直に交わり独立している、つまり、一方の軸に沿って移動しても、他方の軸上での位置が変化しないことです。
By the way, you can see the triangle in the demo above because you’re viewing it from a 3D perspective. Just as we can only see one side of a face at a time, Flatlanders can only view shapes from the side, making everything appear as a line. As objects move, these lines might change in color or length. But similar to how we have a mental image of a full 3D shape from the experience of seeing it from different angles, Flatlanders probably are also able to have a mental picture of 2D shapes in their minds.
ところで、上のデモで三角形が見えるのは、3Dの視点から見ているからです。私たちが顔の片側しか一度に見られないように、フラットランドの住人は形を横からしか見られないので、すべてが線に見えます。物体が動くと、その線の色や長さが変化するかもしれません。しかし我々がさまざまな角度からものを見た経験によって3D形状の完全なイメージを持つように、フラットランドの住人にもおそらく頭の中で2D形状のイメージを描くことはできるでしょう。
We’ve been using coordinate systems in the examples above. While coordinates are a great way to describe the position of things in space, they’re not essential or absolute. You can choose any point as the origin and draw the axes in any direction you want—the coordinates are defined only relative to your choice of origin and axes. You might have noticed that in the 2D demo above, the number goes up when the point goes down. This is opposite to the common convention in math books but is standard for screen-based graphic systems. A space can exist without a coordinate system, and it is just a tool you can introduce when you need to measure things.
これまでの例で座標系を使ってきましたが、座標は空間内の物体の位置を表現する優れた方法の1つに過ぎません。座標系は絶対的でも必須でもありません。任意の点を原点として選んで好きな方向に軸を引くことができ、座標は、選んだ原点と軸に対して相対的にのみ定義されます。
上の2Dのデモでは、点が下に行くほど数値が上がることに気づいたでしょうか。これは数学の慣例とは逆ですが、スクリーン上のグラフィックを扱うシステムでは標準的な方法です。
重要なのは、空間は座標系なしでも存在するということです。座標系は単に物事を測る必要があるときに役立つ道具なのです。
Manifold
多様体
This section is a bit of detour, but let’s pause and look at a fascinating concept: the manifold. The sections above state the 1D space is a (straight) line and the 2D is a plane. But do they have to be? Or if you are in a 2D space, how can you tell that it is really a flat plane?
少し寄り道しますが、多様体という興味深い概念に触れてみましょう。これまで、1次元空間は(直)線、2次元空間は平面だと述べてきました。しかし、必ずしもそうだと言えるでしょうか。仮に2次元空間にいるとして、それが実際に平らな平面だと、どのように分かるのでしょう。
A manifold is a space that, on a small enough scale, resembles a lower-dimensional space, even though it exists in a higher-dimensional one. Which means a 1D manifold looks like a line segment locally and a 2D manifold resembles a plane.
多様体とは、より高次元の空間に存在するにもかかわらず、十分に小さなスケールで見ると低次元の空間に似ている空間のことです。つまり、1次元多様体は局所的に線分のように見え、2次元多様体は平面のように見えるということです。
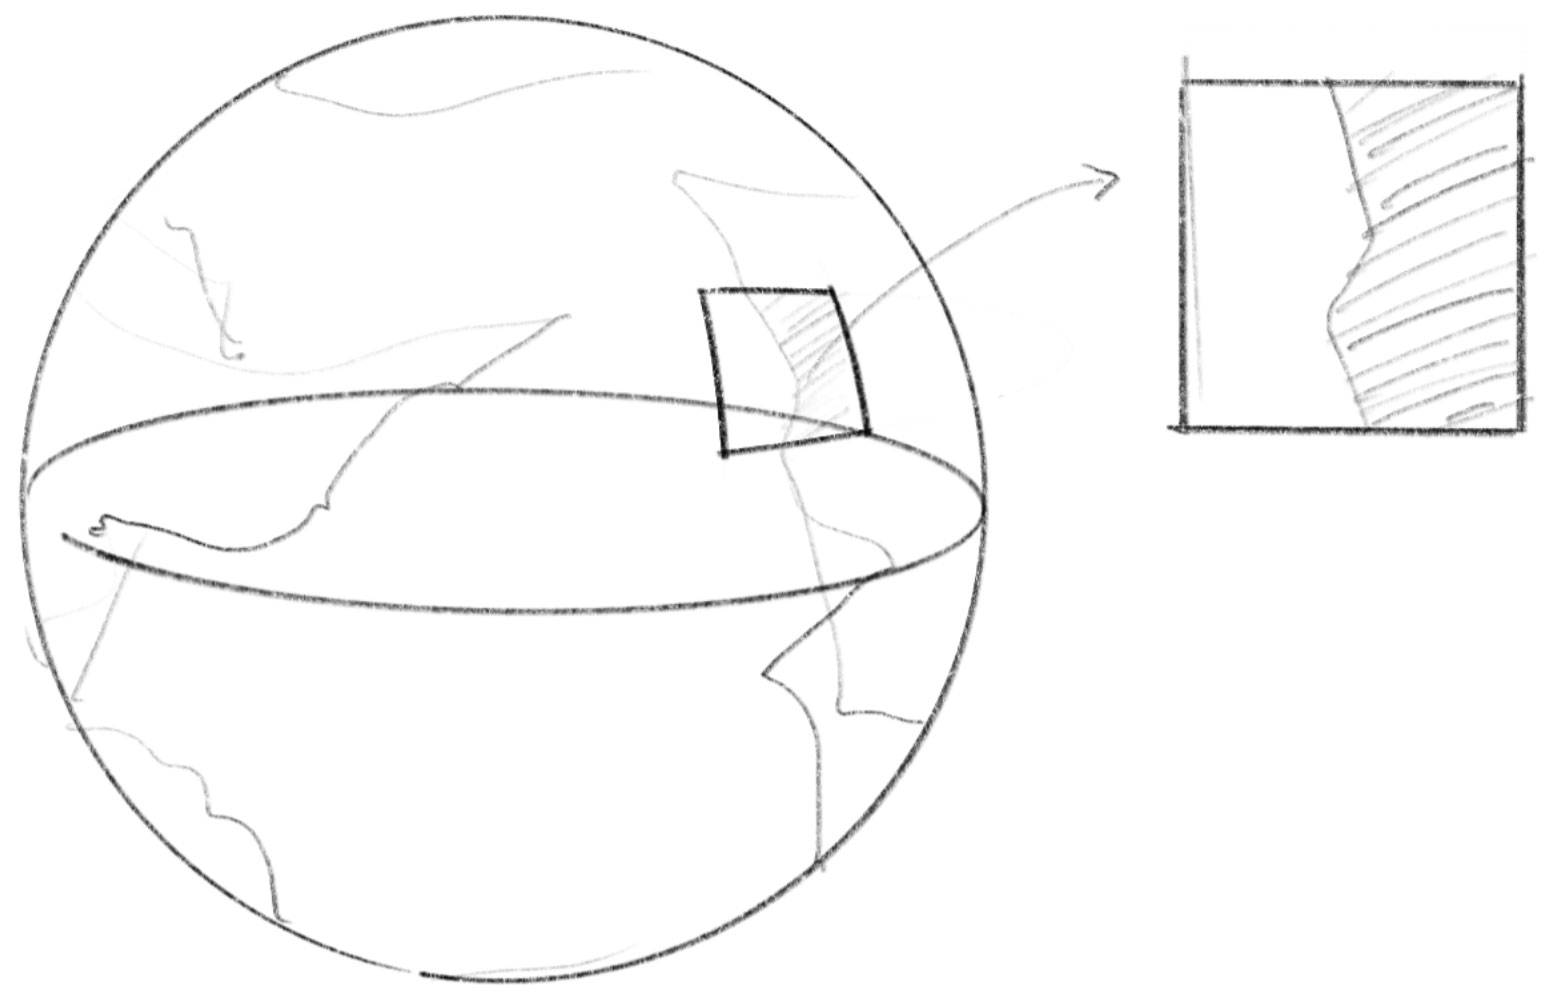
Earth is a great example. While we know Earth is spherical, living on its surface feels like being on a 2D plane. We rarely need to consider the curvature of the surface in our daily lives. At the scale of a city, a flat paper map makes perfect sense, with north-south and east-west functioning as two perpendicular axes (except when you’re near the poles).
地球はこの良い例です。地球が球形であることを知っていても、表面に住んでいると2次元平面にいるように感じます。日常生活では、地表の曲率を考慮する必要はまずありません。都市程度の規模なら、北南と東西が2つの垂直な軸となる平面の紙の地図が完全に理にかなっています(南極や北極の近くにいる場合を除きます)。
The Flatland the Square lives in could be a sphere, torus, or any other 3D shape in reality. But if the shape is so large that its curvature is unnoticeable to the inhabitants, they would simply perceive their world as a flat plane. The Lineland could actually be a curved, blobby shape on a 2D plane. A blobby shape may look very different from a straight line, but it is very similar to a straight line in the sense that we can define a position by a single number relative to the origin.
スクエアが住むフラットランドは、実際には球体、トーラス、あるいは他の3次元形状かもしれません。しかし、その形が非常に大きく、住人にとって曲率が感知できないほどであれば、彼らは自分たちの世界を単に平面として認識するでしょう。ラインランドは、実際には2次元平面上の複雑な形状の線かもしれません。この形は直線とは全く違って見えるかもしれませんが、位置を原点からの相対的な値1つで定義できるという点では、直線そっくりです。
Line Segment, Square, Cube
線分、正方形、立方体
Let’s look at the relationship between different multi-dimensional worlds from a different angle. Starting with the most basic (and only) shape with finite size in 1D—a line segment—we can see how dimensions build upon each other. If you extend a line segment to the same length in a perpendicular direction, you create a fundamental 2D shape: a square.
多次元世界どうしの関係を別の角度から見てみましょう。1次元の世界で有限のサイズを持つ最も基本的な(そして唯一の)形である線分から始めて、次元を増やしていきましょう。線分を垂直方向に同じ長さだけ伸ばすと、2次元の基本的な図形、正方形が作られます。
What is the equivalent of this in 3D? If you expand the square in a direction perpendicular to all its sides, you get—of course—a cube.
3次元で、これに相当するものは何でしょう。正方形をすべての辺に垂直な方向に伸ばすと、当然ながら立方体になります。
Now look at the demo below. Does the last shape look like a cube to you? Maybe yes, maybe not.
下のデモを見てみましょう。最後の形は立方体に見えるでしょうか。見えるという人も、そうでない人もいるかもしれません。
3D and Projection
3次元と投影
Now we are talking about 3D. Similar to what we discussed in 1D and 2D, we can think of three axes that are crossing perpendicular to each other and express a position with three values, representing the position on each of the axes. But a problem arises when we try to draw the third axis. Because we can not have depths on a flat paper or screen, we need a trick to map a point in 3D to a position in 2D to make it “Look like 3D”. This is called “projection”.
3次元について考えてみます。1次元、2次元で議論したのと同様に、互いに垂直に交わる3つの軸を考え、各軸上の位置を表す3つの値で位置を表現します。しかしここで、第3の軸を描こうとすると問題が生じます。平面の紙やスクリーンには奥行きが存在しないため、3次元の点を2次元の位置に対応させて「3次元のように見せる」トリックが必要になります。これを「投影」と呼びます。
If the shape in the demo above looked like a cube to you, that is because you are used to a convention, a way to represent the third dimension on a 2D plane. The z-axis in the demo above was drawn at 45 degrees to both the x- and y-axes.
上のデモが立方体のように見えたとすれば、それは2次元平面上に第3の次元を表現する慣例的な手法の1つに慣れ親しんでいるからでしょう。このデモでは、z軸がx軸とy軸の両方に対して45度の角度で描かれています。
The demo below uses a more common method called perspective projection, which probably looks closer to how we actually see things. In perspective projection, objects appear smaller as they get further from the viewer. This corresponds to the fact that the angle between the edges of the object and the viewing eye decreases as the object moves farther away.
下のデモでは、より一般的な透視投影法を使用しています。これは私たちの実際の視覚により近いと感じられるでしょう。透視投影法では、物体が視点から遠ざかるにつれて小さく見えます。これは、物体が遠くなるほど、その両端と視点との間の角度が小さくなることに対応しています。
Rotation
回転
We take another brief detour here. You have noticed that the cube in the demo above is spinning. Let’s take a brief look at how to rotate a point in a space.
もう一度少し寄り道をします。上のデモの立方体が回転しているのに気づいたと思いますが、ここで、空間内の点を回転させる方法について簡単に見てみましょう。
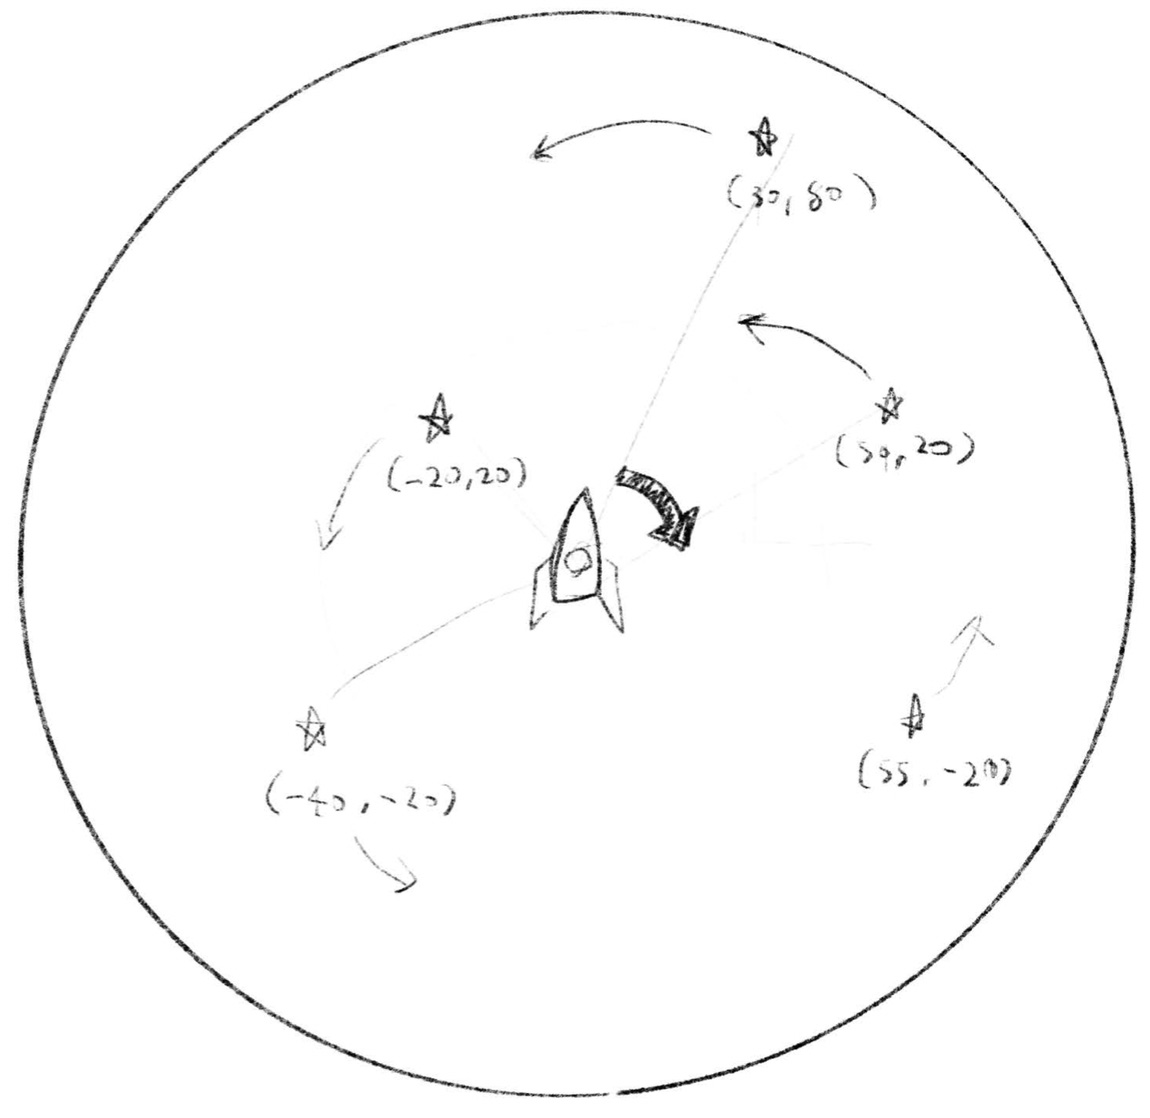
In 2D space, you can use a rotation matrix to rotate a point around the origin.
2次元空間では、回転行列を使って原点を中心に点を回転させることができます。
function rotate2D(point2D, angle) {
  const x = cos(angle) * point2D[0] - sin(angle) * point2D[1];
  const y = sin(angle) * point2D[0] + cos(angle) * point2D[1];
  return [x, y];
}
The cube demo above uses this twice to rotate each point of the cube on the xz plane and then yz plane. The rotateOnPlane function takes two axes to define a plane and rotates the point on that plane. This function is convenient because you can select any two axes in any dimensions and rotate a point, which becomes handy when we are looking at higher dimensions.
上の立方体のデモでは、この関数を2回使って、キューブの各点をxz平面上で回転させ、さらにyz平面上で回転させています。rotateOnPlane関数は、2つの軸を取って平面を定義し、その平面上で点を回転させます。この関数は任意の次元の任意の2つの軸を選択して点を回転させることができるため、より高次元を扱う際にも便利です。
function rotateOnPlane(point, angle, axisA, axisB) {
  const rotated = rotate2D([point[axisA], point[axisB]], angle);
  const newPoint = point.slice();
  newPoint[axisA] = rotated[0];
  newPoint[axisB] = rotated[1];
  return newPoint;
}

function rotateBoxPoint(point, angle) {
  let newPoint = point.slice();
  newPoint = rotateOnPlane(newPoint, angle, 0, 2);
  newPoint = rotateOnPlane(newPoint, angle * 1.5, 1, 2);
  return newPoint;
}
You can learn more about rotation in Rotation and Trigonometry 回転と三角関数.
回転についてより詳しく知りたい場合は Rotation and Trigonometry 回転と三角関数を参照してください。
4D
4次元
Finally we came to here. We’ve been building up all the way to go beyond the 3D dimension we are familiar with. In principle 4D the same as the lower dimensions we have seen. We can assume four axes that are crossing perpendicular to each other, and we express a position with four values. The problem is how to visualize a shape in the 4D space.
ついにここまで来ました。お馴染みの3次元を超えて行くために、ここまで積み上げてきたのです。原理的には、4次元もこれまで見てきたより低次元の世界と同じです。互いに垂直に交差する4つの軸を想定し、4つの値で位置を表現します。問題は、4次元空間の形をどのように可視化するかということです。
The solution is basically the same as the projection from 3D to 2D. We need to come up with a way to map a point in 4D to 2D, or in other words, reduce 4 numbers to 2 numbers. We can think of many ways, but because we already have a great way to project a 3D point to 2D—perspective projection—let’s use it, and then do something very crude and bold: ignore the 4th number. So to project a 4D point to 2D, we take only the first 3 numbers, and project it to 2D as if it is just a 3D point. This may not sound great, because this way a point [1, 1, 1, 1] becomes indistinguishable from [1, 1, 1, 0].
解決策は基本的に3次元から2次元への投影と同じです。4次元の点を2次元に対応させる方法、つまり4つの数値を2つの数値に減らす方法を考える必要があります。様々な方法が考えられますが、3次元の点を2次元に投影する優れた方法、透視投影がすでにあるので、それを使って大胆で大雑把な方法を取ります。4番目の数値を無視するのです。つまり、4次元の点を2次元に投影するために、最初の3つの数値だけを取り、それをあたかも3次元の点であるかのように2次元に投影します。この方法だと点 [1, 1, 1, 1] が [1, 1, 1, 0] と区別がつかなくなるので、あまり良い手法に思えないかもしれません
But what if we rotate the shape? Imagine when we are rotating a 3D cube, depending on the angle, a face of the cube can look collapsed into a line segment when the points and sides align as seen from the viewing point. It’s the same thing. The shape can look collapsed sometimes when they align, but if it is rotating, we can see it from different angles to grasp the overall structure.
しかし、形を回転させるとどうでしょう。3次元の立方体を回転させるところを想像してみてください。視点によっては、立方体の面が点や辺と一直線に並び、線分のように見えることがあります。これと同じ原理で4次元の形も潰れて見えることがありますが、回転させることで様々な形を角度から観察でき、全体の構造を把握できるようになります。
Compare the demo below with the 3D demo above. Can you see that the code structure is basically the same, but this demo just has one extra dimension—one extra number for each point?
下のデモと上の3Dデモを比較してみてください。コードの構造が基本的に同じですが、このデモには1つ追加の次元、つまり各点ごとにもうひとつ1つ追加の値があます。
Does it give you good insights into what the 4D cube (called a tesseract) is really like? It is hard, but try imagining that the 4 lines coming out from each point are actually perpendicular to each other. Can you come up with other ways to draw a tesseract or other 4D shapes? For example, instead of just ignoring the 4th number, can you use it somehow?
これは4次元の立方体(テッセラクトと呼ばれます)の本当の姿について考える助けになるでしょうか。難しいですが、各点から出ている4本の線が実際には互いに垂直であると想像してみてください。テッセラクトや他の4次元の形を描く別の方法を思いつくことができるでしょうか。例えば、4番目の数値を単に無視するのではなく、何らかの方法でそれを利用できないでしょうか。
The last demo on this page is another rendering of a 4D shape with ray marching.
このページの最後のデモは、レイマーチングを使った4次元形状を描くもう1つの方法です。
Very roughly, ray marching is a technique where we mathematically define a shape using a “distance function.” This function returns the distance from a given point to the surface of the shape. We then shoot a bunch of rays—or laser beams—from a viewpoint to measure the distance from the viewpoint to the object’s surface, which is the point where the distance from the ray’s tip to the object becomes very close to zero.
大まかに言えば、レイマーチングとは「距離関数」を使って形を数学的に定義する手法です。この関数は、与えられた点から形状の表面までの距離を返します。関数ができたら、視点からレーザービームのような無数の光線(レイ)を発射し、視点から物体の表面、つまり、光線の先端からオブジェクトまでの距離がゼロに非常に近くなる点までの距離を測定します。
Please read Ray Marching レイマーチング to fully understand the technique and the demo.
この手法とデモをより理解するためには Ray Marching レイマーチング を読んでください。
The distance function is usually defined in 3D or 2D, but here it is defined in 4D. Our rays go in the 3D space, but they will hit the rotating 4D object and tell us where the surface is (or depending on how you interpret the code, you can think our rays are being rotated in 4D and hit the static 4D object). Can you imagine this in your head?
通常、距離関数は3次元または2次元で定義されますが、ここでは4次元で定義されています。視点から飛ばしたレイは3次元空間を進みますが、回転する4次元オブジェクトに当たり、表面がどこにあるかを教えてくれます(コードの解釈によっては、4次元空間で回転させたレイが、静止した4次元オブジェクトに当たると考えることもできます)。頭の中で想像できるでしょうか。
As opposed to the “projection” demo above, which forces any 4D points to project onto a 2D plane, this is like “slicing.” If you slice a cube with a plane, you can get different 2D shapes from triangles to hexagons. Because our rays exist only in a single 3D space, the part of the 4D shape that doesn’t intersect with the 3D space doesn’t get rendered. As a result, the shape appears to be morphing, but it is actually the same 4D shape sliced with a 3D space.
このデモは上の投影のデモとは異なり、4次元の点を2次元平面に強制的に投影する代わりに、空間を「スライス」します。立方体を平面でスライスすると、三角形から六角形までのさまざまな2次元の形が得られます。このデモ内のレイは単一の3次元空間にのみ存在するため、4次元の形のうち、その3次元空間と交差しない部分はレンダリングされません。結果として形が変化しているように見えますが、実際には同じ4次元の形状が3次元空間によってスライスされているのです。
5D and beyond
5次元以上の空間
Now we understand the pattern, we can go higher up to 5D or any number of dimensions beyond. Higher dimensions may feel too abstract and like just a thought experiment, but if you think of a point in higher dimensions as a point specified by a lot of value, or a vector, multidimensional data is everywhere. You can think of an RGB color as a point in a 3D space, and statistical data consisting of 7 numbers (let’s say you have data about a population and each person has 7 parameters like age, annual income, etc.), you can think of it as a point in 7-dimensional space.
これまで見てきたパターンは、5次元やそれ以上の次元にも拡張できます。高次元は抽象的で単なる思考実験のように思えるかもしれませんが、高次元の点を多くの値で指定された点、つまりベクトルとして考えると、多次元のデータは至る所にあることがわかります。RGBカラーを3次元空間の点として考えたり、7つの数字からなる統計データ(例えば、ある集団のデータで、各個人が年齢や年収などの7つのパラメータを持っているとします)を7次元空間の点として捉えることができます。
The merit of thinking of them in terms of multidimensional space is that we can introduce very useful concepts like distance or angle between points to measure similarity, or various ways to collapse or project the space to create useful visualizations or summaries.
多次元空間としてこれらを考える利点は、点の間の距離や角度といったとても便利な概念を用いて類似性を測定したり、空間を圧縮したり投影したりする様々な方法を用いて、可視化したり情報を要約したりできることです。
In fact, AI models like GPT-4 or Gemini encode concepts like dog, human, run, happy, etc., as hyper-dimensional vectors (for example OpenAI’s text-embedding-3-large creates embeddings with up to 3072 dimensions). Imagine a space where all the concepts and words are floating, sorted by similarity so that similar concepts are nearby, and opposite words are far away.
実際、GPT-4やGeminiなどのAIモデルは、犬、人間、走る、幸せなどの概念を超高次元ベクトルとしてエンコードします(例えば、OpenAIの text-embedding-3-large は最大3072次元のベクトル表現を生成します)。全ての概念や単語が類似性によって並べられ、似た概念が近くに、反対の言葉が遠くに浮かんでいるような空間を想像してみましょう。
You can learn more about vectors and how to do various calculations in the multidimensional world on the Vector Operations ベクトルの操作
多次元世界におけるベクトルとさまざまな計算方法については、Vector Operations ベクトルの操作ページでさらに詳しく学ぶことができます。